Support

Support refers to a price level where an asset is expected to stop falling and reverse. At this line, the buyers’ activity increases. It acts like a floor and prevents the quote from moving lower. Support can equally be used by CFD and digital option traders. They are used by market participants to find entry points to buy an asset.
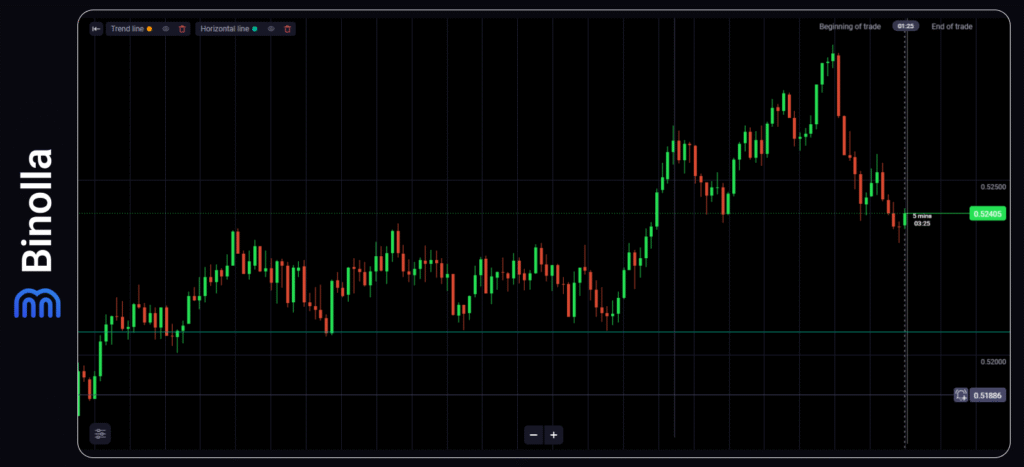
The support line is drawn through lows that are located on the same level or in the same area. Market participants look for support when they want to buy a Higher contract or open long trades when trading CFDs. Support levels are not exact, which means that points may be at slightly different levels, like 1.1400, 1.1398, 1.1403 for EUR/USD, for instance. Keep in mind that if the price breaks below the support level, it may signal a strong downside momentum.
How to Identify Support Levels
To trade with support levels, you need to know how to spot them on charts. Here are some of the most popular tools that will help you see these levels:
- Horizontal line. The simplest tool to spot the support level. It is drawn manually through the lowest points, helping you find the area where the price may stop and reverse upwards.
- Moving averages. If you don’t want to draw the support level manually, you can use the moving average indicator with a period of 50 or 200, depending on your timeframe and goals.
