Pivot Points in Trading: Basics for Beginners

There are plenty of indicators and drawing tools that you can use to find entry points in trading. Some of them are fairly simple, while others may seem complex. Anyway, all of them may be very useful if you know how to use them.
While there is quite a straight line between drawing tools and indicators, sometimes it is blurred when it comes to such tools as pivot points. By reading this article, you will learn more about this hybrid drawing tool and indicator and find out how to use it. Start trading now and create an account at Binolla.
Contents
Pivot Points: Basic Information
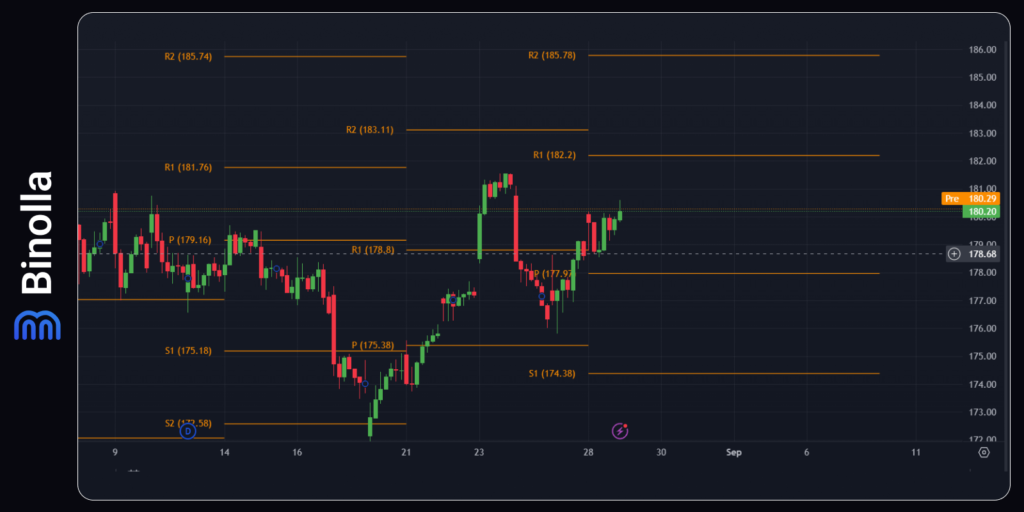
Pivot points are widely known and used by traders of all types. They help them identify various levels as well as a line that balances prices for a particular period. The main idea of this hybrid is to provide traders with information about current market moods. If the price stays above the pivot point line, the market is supposed to be bullish, while if it stays below the PP line, the market is supposed to be bearish.
In general, pivot points are a form of support and resistance lines that are adjusted automatically according to the current market situation. They are also very helpful when traders tend to identify where prices can fall or grow within a particular period.
Pivot Points Calculations
Being a hybrid of an indicator and a drawing tool, pivot points have calculations behind the scenes that help draw the lines on the chart. Unlike support and resistance levels that you apply to the chart without doing any calculations, the pivot point indicator is entirely based on math. The lines are drawn according to the following formulas:
- PP = previous high+previous low+previous close/3;
- Support 1 (S1) = (PP x 2) – previous high;
- Support 2 (S2) = PP – (previous high-previous low);
- Resistance 1 (R1) = (PPx2) – previous low;
- Resistance 2 (R2) = PP + (previous high – previous low).
These calculations may seem complex to you, but they are given here for your information only. You are not going to apply them anywhere, as everything is done by the indicator automatically. Once you apply it to the chart, you will see all the lines drawn for a particular day and several previous days.
Types of Pivot Points
After you open the pivot points indicator settings, you will see that there are several types of it inside the Inputs tab. The main varieties include:
- Standard PP indicator. This is one of the most popular types of pivot points indicator that is based on the calculations of the previous day’s high, low, and closing prices;
- Fibo PP. As you may guess from its name, this type of PP indicator uses a fibonacci sequence to calculate the distance between the lines. Similar to standard PP, the high and low of the previous trading day are taken as a basis, but Fibonacci retracement is used to make all other calculations;
- Woodie PP. Unlike the standard PP indicator, in Woodie’s version, the previous day’s high, low, and opening prices are involved;
- Camarilla PP. When it comes to this type of pivot points, they are calculated using a different formula and provide traders with tighter support and resistance levels, which, in turn, may be very useful during intraday trading.
Pivot Points Basic Strategies
There are plenty of strategies that you can use when applying the pivot points indicator to the chart. The first and one of the simplest trading tactics with this indicator is looking at the price crossing the middle line, also known as PP.
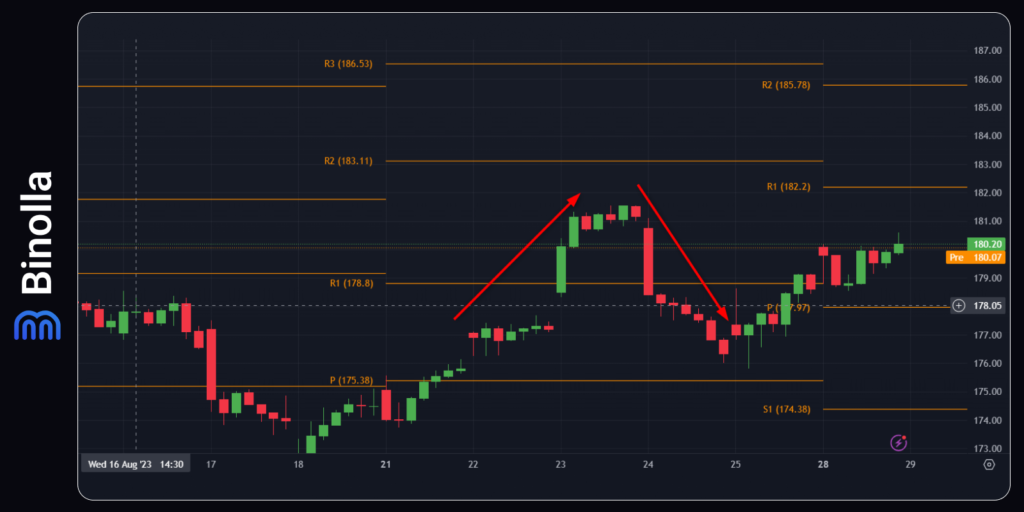
This approach requires simply looking at charts and waiting for the moment when the price crosses the PP (middle line). When the price goes from below, crosses the PP lines, and goes higher, this is a great opportunity for a trader to buy a Higher contract or buy a currency pair, stock, or any other asset.
On the other hand, when the price falls below the PP line, this is a signal for a trader to buy a Lower contract or buy a currency pair, stock, or other assets.
Trading PP with Candlesticks
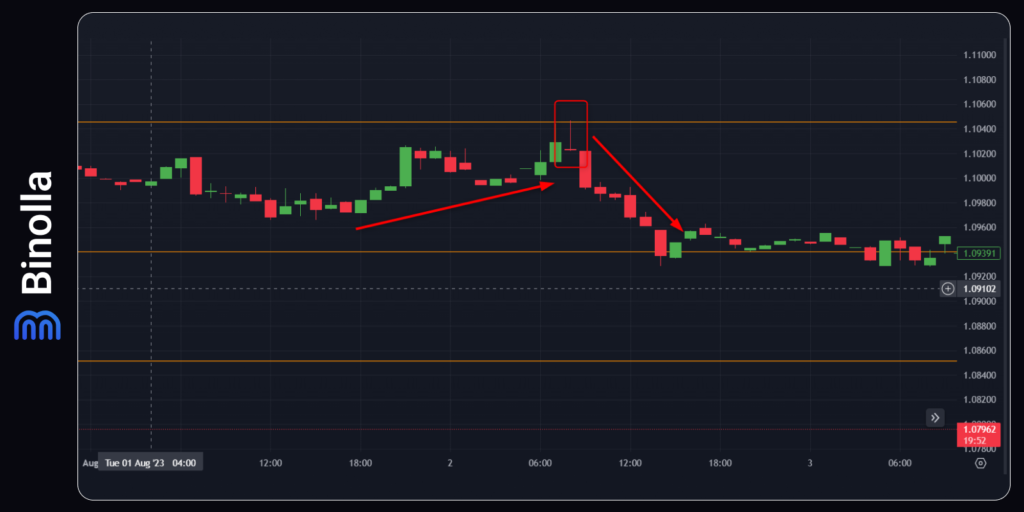
Using pivot points may be even more beneficial if you add some other systems, including candlestick chart patterns. The example above shows how you can use those patterns to find better entry points.
Here you can see the Shooting Star pattern that hits the resistance level and then steps back. Once you see this situation, you can buy a Lower contract or simply sell the asset.
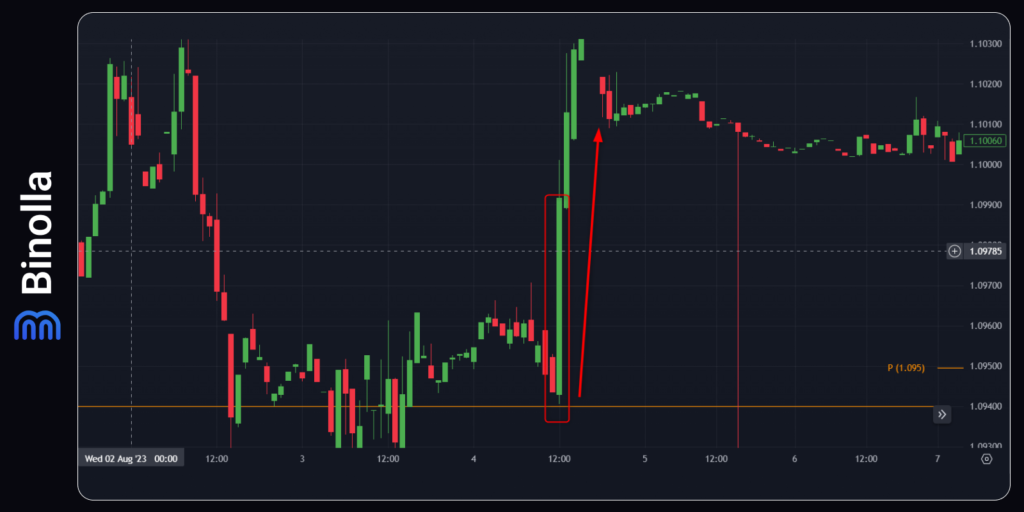
Another example of trading with PP and Japanese candlestick patterns is presented above. Here you can see Bullish Engulfing, which takes place close to the support level. In this particular situation, you can buy a Higher contract or buy an asset.
Trading with Trendlines
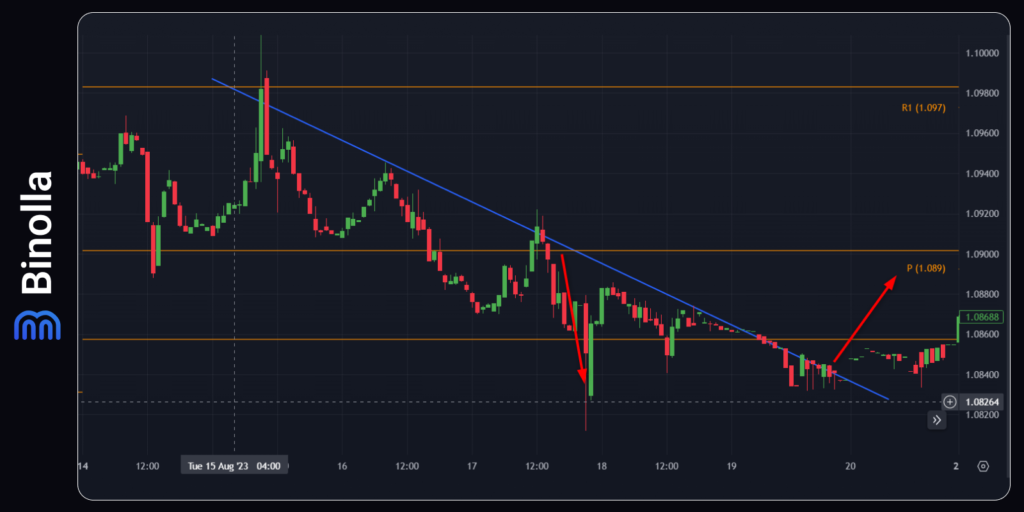
Using trendlines is another great strategy to try. The idea here is to sell after the price hits that descending trendline and reverses. Pivot Points here can be used as target levels for FX or stock trading. Moreover, if the trendline confluences with one of the pivot levels, this is a stronger signal for traders to buy a digital option contract or buy/sell various assets.
In the example above, you can see a descending trendline and pivot points. Once the price reverses after touching the trendline for the third time, you can buy a Lower digital option or sell a currency pair or a stock. As you can see, the third reversal point appears after hitting the descending trendline and making a fake breakout of the resistance level, which is formed by PP.
The second entry point is formed when the price breaks the descending trendline. This is an opportunity to buy a Higher signal or buy a currency pair/stock.
Common Mistakes When Trading with Pivot Points
Traders often make mistakes when trading with pivot points. To buy digital contracts or other financial instruments more efficiently, it is recommended to pay attention to the following mistakes and try to avoid them in your trading routine:
- Using one timeframe only. When trading FX or stocks, traders often use only one timeframe and miss a lot of opportunities. Using various timeframes, on the other hand, allows you to find a lot more entry points or even watch the whole situation on higher timeframes;
- Using pivot points only. When trading with pivot points, you can add various additional tools like indicators, candlestick patterns, drawing tools, etc. This will make your trading strategy more effective and will allow you to find more precise entry points;
- Not adjusting to changing market conditions. While pivot points are very effective when the price makes significant movements, they may be almost useless during periods of low volatility. They may not provide clear levels under such market conditions. Therefore, it is recommended to use the PP indicator if, and only if the market volatility is at least medium;
- Not using money management. While pivot points are good at providing fine entry points, they do not guarantee 100% results in each particular trade. Thus, you should always think about protecting your money from extraordinary risks and how much to invest in each particular trade.
Pros and Cons of Using Pivot Points
Using the PP indicator will provide you with the following benefits:
- This indicator provides a clear understanding of market sentiment. If the price is below the middle PP line, the market is supposed to be bearish, while if the price is above, the market is considered to be bullish;
- Pivot points help traders manage their risks by offering them levels where the price can stop and reverse;
- You don’t need to draw the lines on your own, as they appear automatically once you apply the indicator;
- Traders are not required to adjust lines. Each new day, pivot points resistances and supports are rebuilt automatically according to the prices of the previous trading day.
When it comes to the drawbacks of using the PP indicator, they are the following:
- Pivot points are limited in trending markets as the price may go beyond the lines;
- Pivot points interpretation can be subjective. It depends on the trader’s proper analysis;
- Similar to many other indicators, PP should not be used as a standalone tool. It is better to add other indicators, patterns, and systems to trade;
- The PP indicator is based on historical prices. Therefore, they can not be accurate in changing markets.
Final Words
Pivot points are a special indicator that draws support and resistance levels automatically. It helps traders find entry points as well as predict future price reversals and place better stop losses and take profits.
Applying pivot points to the charts is very simple. There are plenty of strategies that you can use with this tool. Traders often create their own tactics based on various support and resistance levels.
FAQ

Do Professional Traders Use Pivot Points?
Yes, they do. Pivot points are very popular among traders. They often use resistance and support lines to find entry points. Pivot points allow you to draw these levels automatically, which makes it easier to trade.
How Do Pivot Points Work?
Once you apply this indicator to the chart, all support and resistance lines are drawn automatically. They are calculated according to formulas that are included in the indicator.
What is the Most Popular Pivot Points Strategy?
The most popular strategy that you can use when trading with pivot points is when the price reverses from any of the levels.
Can I Trade Stocks with Pivot Points?
Yes, you can. Traders can choose any type of asset and apply pivot points to the charts. Moreover, you can use this indicator when trading digital options and other derivatives.


