MetaTrader 5 Types of Charts: A Detailed Guide
Metatrader 5 offers three types of charts to traders. You will be able to choose from Lines, Bars, and Japanese Candlesticks, which are among the most popular ways to read the price. Traders can easily switch between them to make the most out of their strategies. By reading this guide, you will learn more about how to switch between charts, set them up, and create chart templates. We will also provide you with useful insight into all types of charts available on the platform.
Ready to trade? Create an account at Binolla and make your way to financial wealth.
Contents
Types of Charts on the MT5 Platform
Now that you know how to change types of charts and how to adjust their settings on the MetaTrader 5 platform. Let’s look closer at each of the chart types.
Japanese Candlesticks
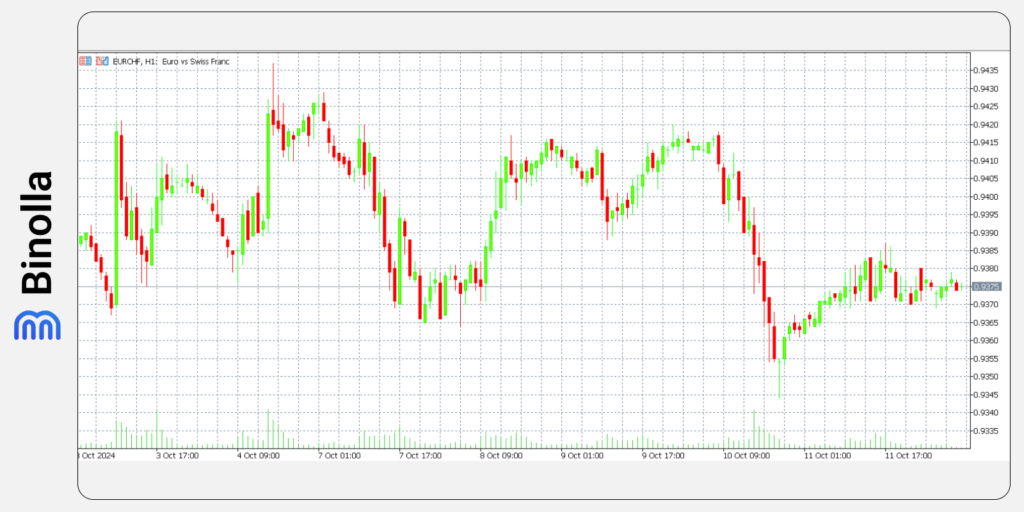
Japanese candlesticks were invented in the 1700s in Japan and they are very popular nowadays. The chart consists of a series of candles with a vertical body and tails. There are two types of candlesticks – bearish and bullish. They have different colors and reflect the price direction for a particular period.
A bullish candlestick (green) has a lower edge which is the open price and a higher edge which is the close price. The upper wick demonstrates the maximum price for a period, while the lower wick shows the lowest price for the same period. When it comes to the bearish one, the upper edge demonstrates the open price, while the lower edge is the close price.
Apart from reflecting the current price, Japanese candles are widely used as an analysis method, allowing traders to pinpoint market trends and even find market reversals or corrections. So-called patterns provide traders with information on where to place the next order and even where to leave the market.
OHLC or Bar Charts
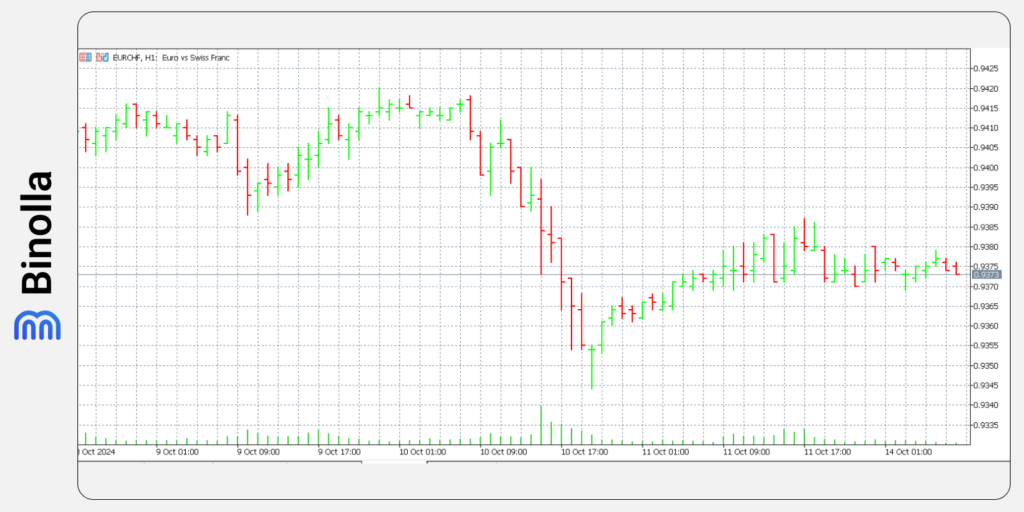
Similar to Japanese candlesticks, OHLC shows traders open, close, high, and low prices. This data allows market participants to see what has happened during a particular period. Apart from learning more about the prices for a particular period, the OHLC chart uses bars to pinpoint market trends. Similar to Japanese candlesticks, bars come in two colors. While you can change them, the standard ones are green for bullish and red for bearish bars.
Vertical lines in bar charts are the bones of OHLC demonstrating the distance between the extremes of a particular bar. Horizontal lines show the open and close levels. A horizontal line on the left side is the open price for a particular OHLC, while one on the right stands for close price.
Line Charts
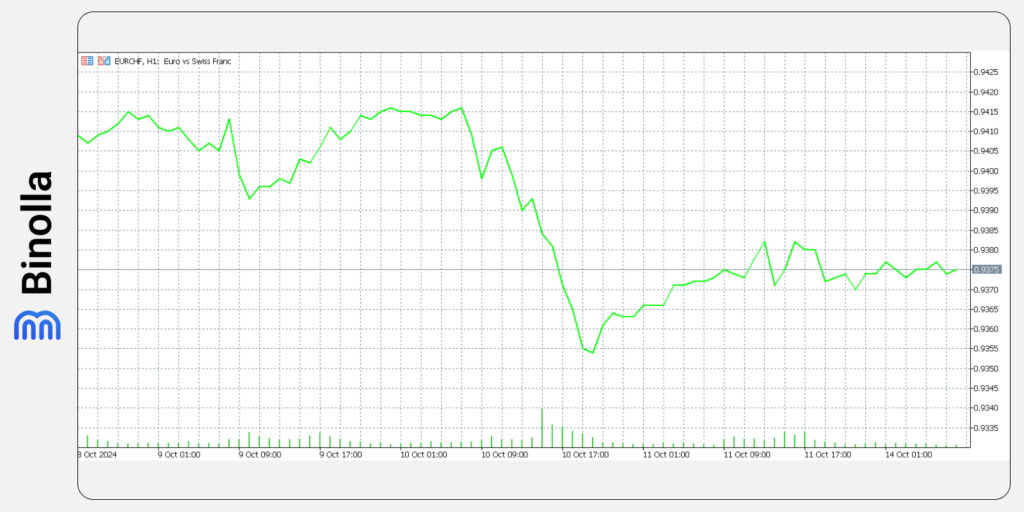
Line charts are the basic type of chart, which represent a line. The only parameter that you can see on the chart is the current price os the asset. The line chart is a set of points that are connected by lines. It is widely used by traders who are not interested in additional information such as open or close prices for a particular period.
Switching Between Charts and Setups on the MT5 Platform
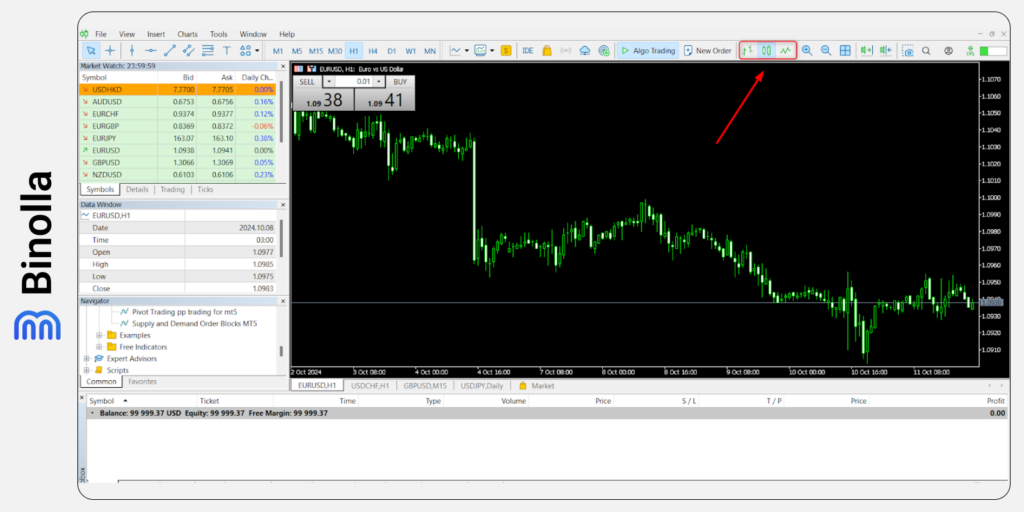
Once you download and install the platform, the default chart will be Japanese candlesticks. This is one of the most popular types of charts so far, which is the main reason for making it available right away. However, if you want to switch between charts to trade with lines or bars, you can click one of the buttons that are highlighted in the screenshot above.
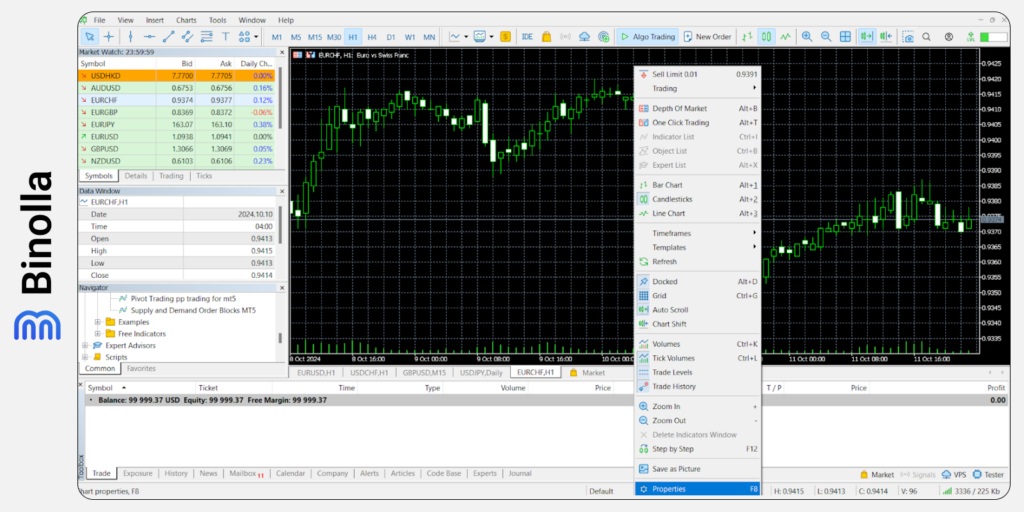
Each type of chart has a set of settings that are available once you reach the Properties section of the platform. Let’s look closer at the options that you can change on the MetaTrader 5 platform.
Common Settings
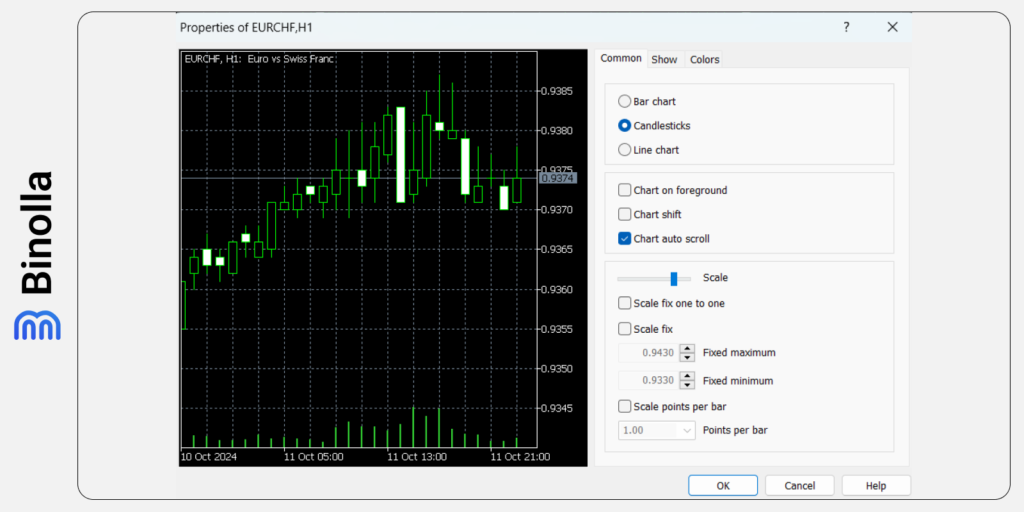
The common settings tab in the properties includes:
- Bar chart. Here you can switch to the bar chart;
- Candlesticks. Here you can switch the chart to candlesticks;
- Line. Here you can switch the chart to line;
- Chart in foreground. If you choose this option, all analysis tools that you add to the chart will appear in the background;
- Chart shift. By choosing this option, you will shift the chart from the right part of the screen to the shift mark. This may be comfortable if you don’t like to see the price close to the price scale in the right part of the screen;
- Chart autoscroll. This option enables an automatic scroll of the chart to the current price. If you need to analyze some previous periods, it is better to leave this box unchecked;
- Scale. By using the scale option, you can set the zoom of the chart. You will see how the scale changes in the preview window left to the settings part;
- Scale fix one to one. This option allows you to fix the chart scale as one to one, which makes the size of the pip of the vertical axis equal to the distance between the bar axes in pixels. With this mode on, traders can draw precise shapes
- Scale fix. The option allows market participants to fix the chart scale vertically;
- Scale points per bar. This option fixes the chart scale by the ratio of points on the vertical axis to one bar.
Show Settings
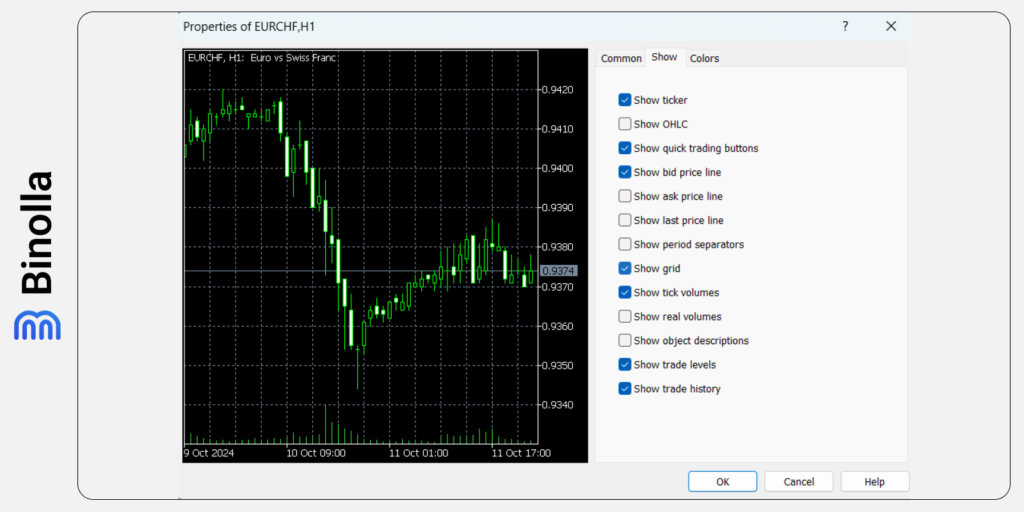
The Show window in the settings menu contains the following points:
- Show ticker. By activating this checkbox, you will add the ticker to the top-left corner of the chart. This option is activated by default;
- Show OHLC. This option switches on the OHLC line right to the ticker. This additional data line shows the current open, high, low, and close prices. Therefore, by activating this option, you will see the latest price parameters;
- Show quick trading buttons. This option enables you to use quick trade buttons and see the depth of the market on the chart;
- Show the bid price line. With this option, you can show or hide the bid price level of the latest price. This horizontal line corresponds to the bid price level of the latest price that appeared on the chart;
- Show ask price line. With this option, traders can make the ask price line visible on the chart;
- Show last price line. This line demonstrated the price at which the latest trade was executed;
- Show periods separator. Such an option demonstrates periods on the chart. The date and time of each bar are displayed on the horizontal axis of the chart. The scale interval is equal to the timeframe that you have chosen previously;
- Show grid. This option allows traders to add or remove grid from charts. Grids are useful when you draw lines and shapes;
- Show tick volumes. By turning on this mode, you will see the tick volume below the chart;
- Show real volumes. This option shows volumes calculated on the real number of executed trades;
- Show object descriptions. By activating this box, you will see the descriptions of objects on the chart;
- Show trade levels. This option shows or hides the price levels at which the position was opened or the pending order was placed. Also, you will see your stop loss and take profit levels;
- Show trade history. With this option, traders can see entries and exits on the chart for a particular instrument.
Colors Settings
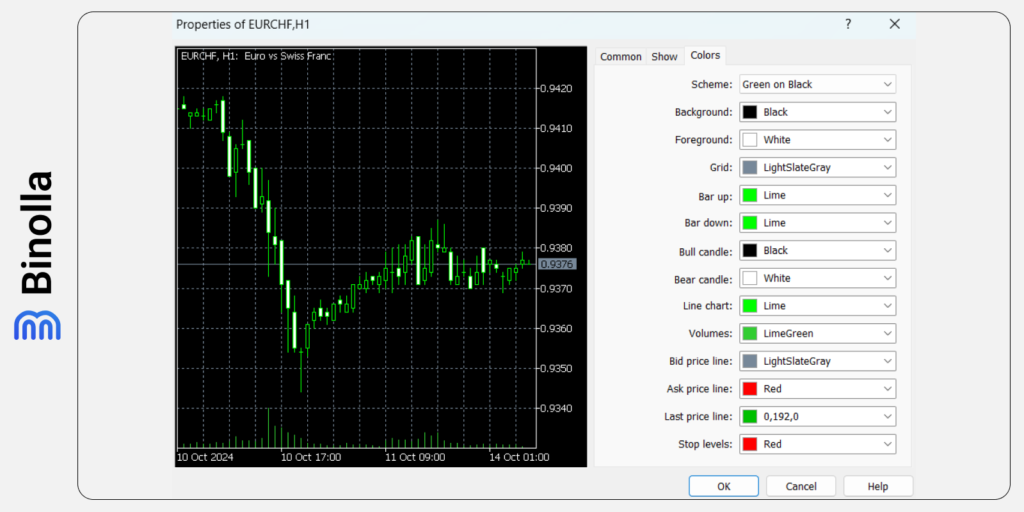
Colors settings on the MT5 platform
The MetaTrader 5 platform allows market participants to change the color scheme of the chart:
- Scheme. You can select a predefined color scheme for the chart. There are four schemes available by default. Also, you can save your custom color scheme and load it as a template later;
- Background. This one allows you to change the color of the background, which is black by default;
- Text. This option changes the color of the text, axes, scale, and OHLC line;
- Grid. As it comes from its name, this option changes the color of the grid;
- Bar up. This option changes the color of the edges and tails of a bullish candlestick;
- Bar down. With this option, you can change the edges and tails of the bearish candlestick;
- Bull candle. This option changes the color of the body of the bullish candlestick;
- Bear candle. With this option, you can change the color of the bearish candlestick;
- Line chart. This option changes the color of the chart and doji candlesticks;
- Volumes. You can change the color of volumes on the chart;
- Bid price line. One can change the color of the bid price line on the chart;
- Ask price line. The option changes the color of the Ask price line on the chart;
- Last price line. Similar to previous settings, this one changes the color of the last price line;
- Stop levels. You can change the color of stop losses and take profit orders.
Using Chart Templates on the MetaTrader 5 Platform
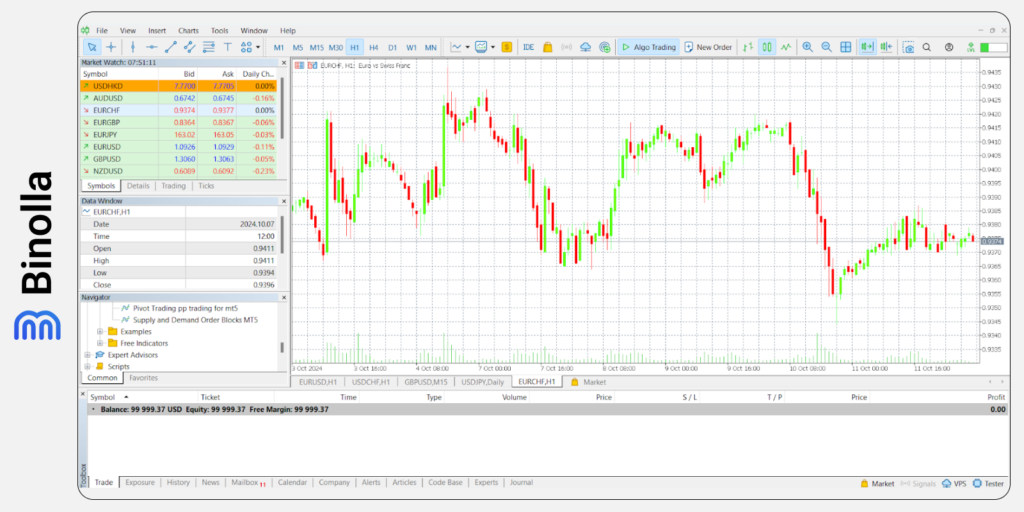
Each time you add a new chart to the MT5 chart window, it will have default settings (black background, green candles, etc.). However, if you want to apply your own settings to all new charts that you add, you can use templates. Here is how to do it.
1: Set the settings of a chart of a particular asset according to your wishes.
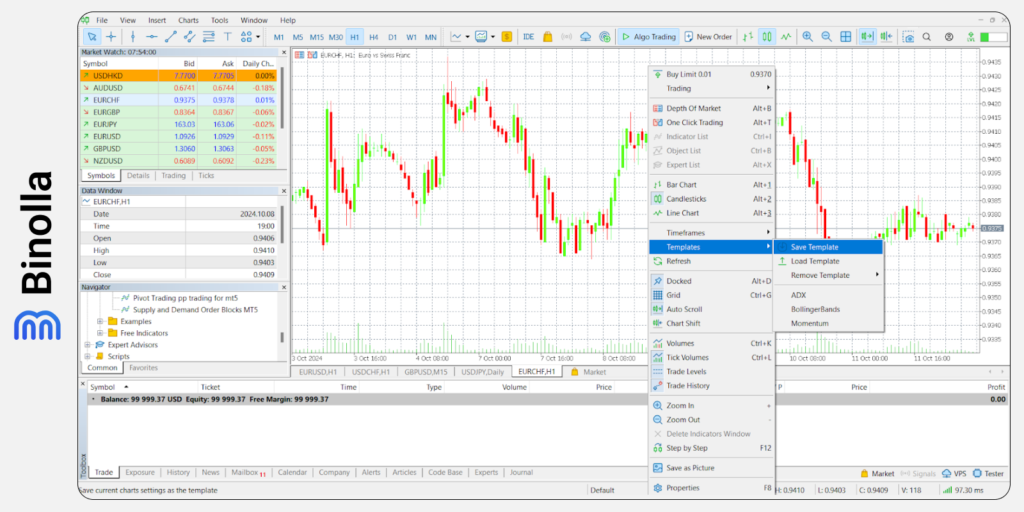
2: Right-click on the chart with your settings, choose Templates in the pop-up menu and click Save Template.
3: Save a template by creating a name and clicking the Save button.
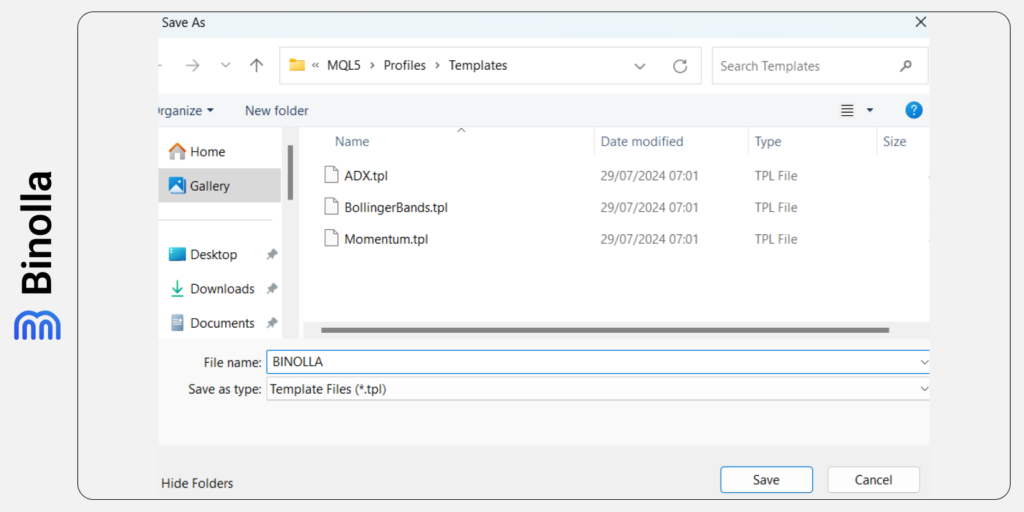
Creating a name for the template
4: Add a new chart to the platform.
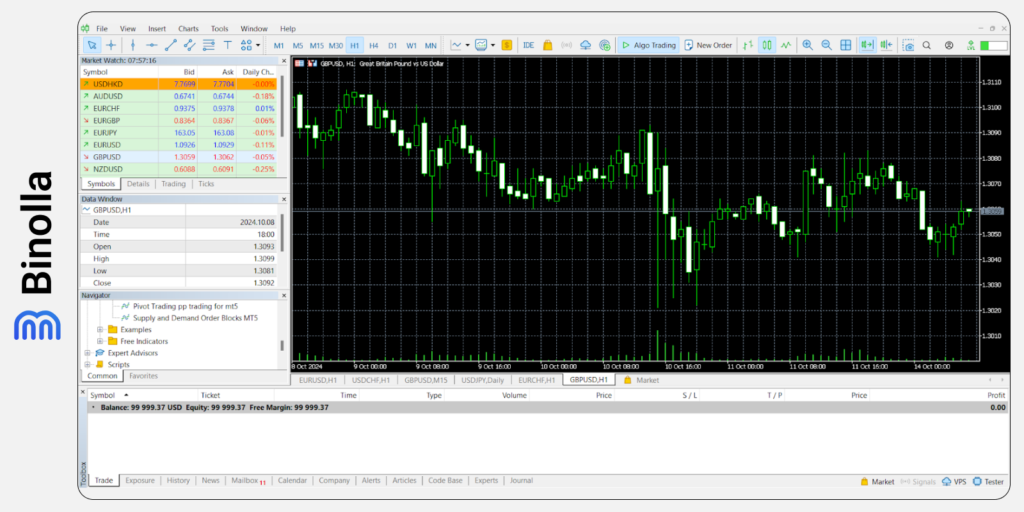
5: Load your previously saved template.
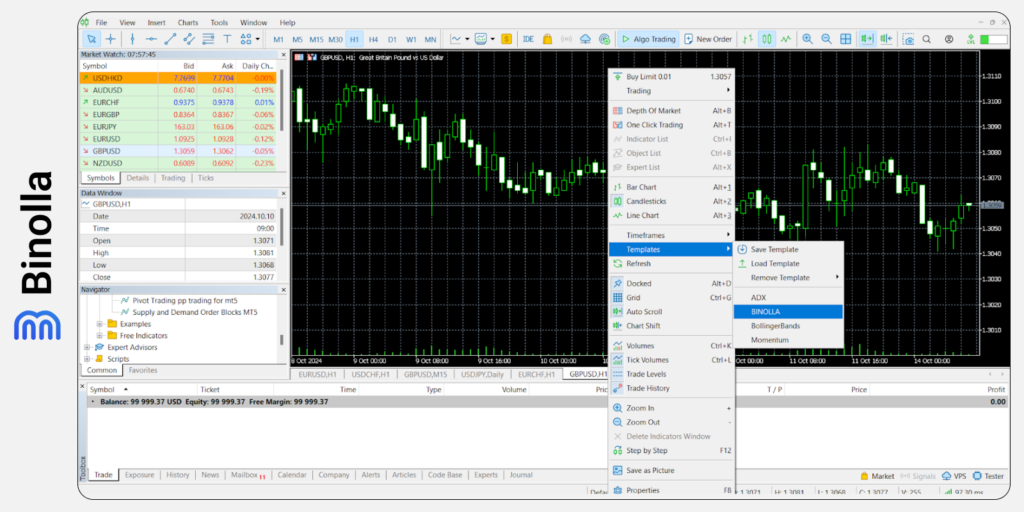
That’s all. Now you can enjoy your new chart window with the settings from your template.
How to Set Multiple Charts
The MT5 platform allows traders to set multiple charts in one chart window. With this option, you can follow the prices of several assets without switching between them. This will allow you to monitor correlations and conduct multiple-asset trading with better precision.
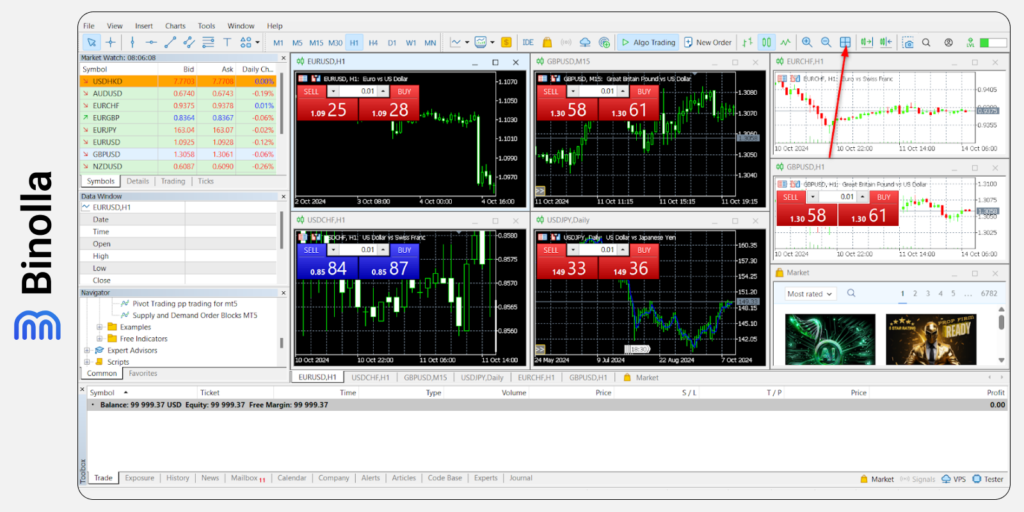
To do that, you need to simply press the button at the top of the screen of the MetaTrader 5 platform. You will see that instead of one chart, you will add several ones of all the assets that are currently active. You can also close all charts that you don’t need to use by clicking the cross icon.
The Difference Between Candlesticks, Bars, and Line Charts
All three types of charts are designed for their own purposes. Let’s look closer at their differences so that you can make your own choice.
Perception
Bars are the most complex types of charts especially for newcomers. Their horizontal and vertical lines may confuse beginners, while Japanese candlesticks, which are less complex, can be used by beginners almost at once. Lines are the easiest chart types with the current price only.
Information
Both bars and candlesticks provide traders with a set of information about the open, close, high, and low prices. This information can be used by market participants to make future price forecasts based on patterns. When it comes to line charts, they are less informative providing traders with the current price data only.
Technical Analysis Opportunities
Bars and Japanese candlesticks are widely used by traders to find market reversals and corrections. This helps market participants establish clear entry points and set price targets. When it comes to lines, they are used by traders to find price action patterns based on various shapes such as rectangles, double top, double bottom, triangles, and many others.
Market Noize
Lines are considered the best chart when it comes to market noise. Bars have less noise as compared to Japanese candlesticks. The latter produces the most noise, especially in times of range trading.
FAQ
What Are the Three Types of Charts Available on the MT5 Platform?
The MetaTrader platform offers three types of charts that include line charts, OHLC, and Japanese Candlesticks. You can easily switch between them on the platform in one click.
How Many Charts I Can Open on the MetaTrader 5 Platform?
Traders can open an unlimited number of charts simultaneously on the MetaTrader 5 platform. This will allow them to conduct deep intermarket analysis and apply various diversification strategies.
How Do I Change the Chart Type on the MT5 Platform?
To do that, you can click the type of chart icon in the menu above the chart on the MetaTrader 5 platform. You can also switch between charts in the settings menu.
How Do I Change the Default Template on the MT5 Platform?
To change the default setup, you need to go to the Properties menu of the MetaTrader 5 platform and change the settings there. You can also save them in order to be able to quickly enable them when adding new charts.
How do I Reset My MT5 Chart?
To do that, you can click on the chart tab below the chart window and choose Close there.


