Main Reversal Strategies for Digital Options: Profiting from Market Corrections

With the emergence of new technologies and the appearance of modern trading platforms, traders can place quick trades and capitalize on various price fluctuations. Reversals provide market participants with the opportunity to earn money in situations when one trend replaces the previous one or a correction takes place.
Digital options traders can use reversals to buy Higher and Lower contracts with higher chances of succeeding. There are plenty of strategies market participants can use to catch reversals and capitalize on them. In this article, we will explain the meaning of reversal and provide traders with some basic strategies that they can use to buy contracts. Those who already have a reliable strategy, can open an account at Binolla and start trading!
Contents
- 1 Market Trends and Reversals Basics
- 2 An Example of Using Reversals in Trading
- 3 How to Find Reversals in Trading
- 4 Basic Strategies for Finding and Trading Reversals in Digital Option, Forex and Stock Trading
- 5 Experiment with these strategies now!
- 6 Reversal Strategies Using Candlestick Patterns
- 7 Key Recommendations to Consider When Using Reversal Strategies
- 8 FAQ
Market Trends and Reversals Basics
Before delving into market reversals, it is worth talking about trends. A trend is a directed price movement. During the uptrend, lows increase gradually, as the price goes higher. In times of downtrends, on the other hand, highs decrease gradually. Trends are not eternal in trading. They are only about 30% of the time. Therefore, when they end, a reversal takes place.
What Does a Reversal Mean in Trading?
A reversal, as we have already mentioned, occurs when one trend ends and another trend begins. In intraday trading, reversals are frequent and quick, while long-term reversals are rare and slow. Similar to trends, reversal can be found on different timeframes.
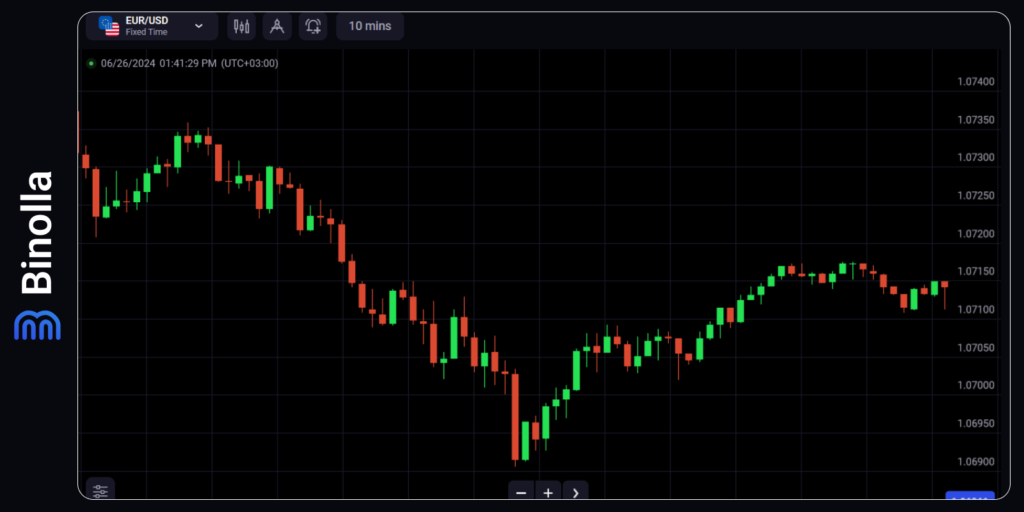
This is a very important note as reversals on a 5-minute timeframe don’t matter to position traders and investors who aim at holding an asset for weeks and months. However, such five-minute timeframe reversals are very important to short-term traders, including those buying digital contracts.
A Reversal or a Correction?
Not all situations when the price reverses can be considered a reversal. In some cases, trends need a pause when buyers or sellers take a rest before investing more and moving the price further. At these times, the price stops and even makes a short reversal, which is known as a correction. It should be mentioned that it is very difficult to distinguish a reversal and a correction, especially in the early stages when both are similar to a reversal.
For digital options traders, there is no difference in most situations whether to trade a correction or a full-fledged reversal. If you buy a 1-minute contract, for instance, on the minute chart, even one candlestick may bring you profit. Therefore, whether it is a correction or a trend-reversal situation, a digital option trader can benefit from both.
When it comes to FX, stock or crypto traders who use so-called “Contracts for Difference”, which are not limited by expiration, the effectiveness of their trades depends directly on the number of pips the price covers. Therefore, a correction to a trend, especially when it is brief, may not be the best trading solution. CFD traders should find full-fledged reversals to capitalize on them. While making a difference between a correction and a reversal is quite difficult, there are some ways to complete this task. Find more about them in the following lines.
Ways to Distinguish a Correction and a Reversal
There are three main ways to distinguish a reversal. They include:
- Trendlines. This line prevents the price from going further in the direction opposite to the main trend. When a correction develops, a trendline can be broken but the price, but such breakouts are known as fakeys and they should not be considered by traders;
- Volumes. Corrections are accompanied by lower volumes, while reversals are mostly accompanied by higher volumes as more market participants join the market;
- New extremes. New extremes will confirm a correction, while when the trend is over, there will be no new highs during the uptrend and no new lows during the downtrend.
Now that you know some of the most popular ways to distinguish market corrections and reversals we are going to show you some basic reversal strategies with all the above-mentioned methods in the following paragraphs.
An Example of Using Reversals in Trading
Before going to strategies, it is worth looking at a couple of examples. First, let’s consider a situation when the price reverses after the uptrend.
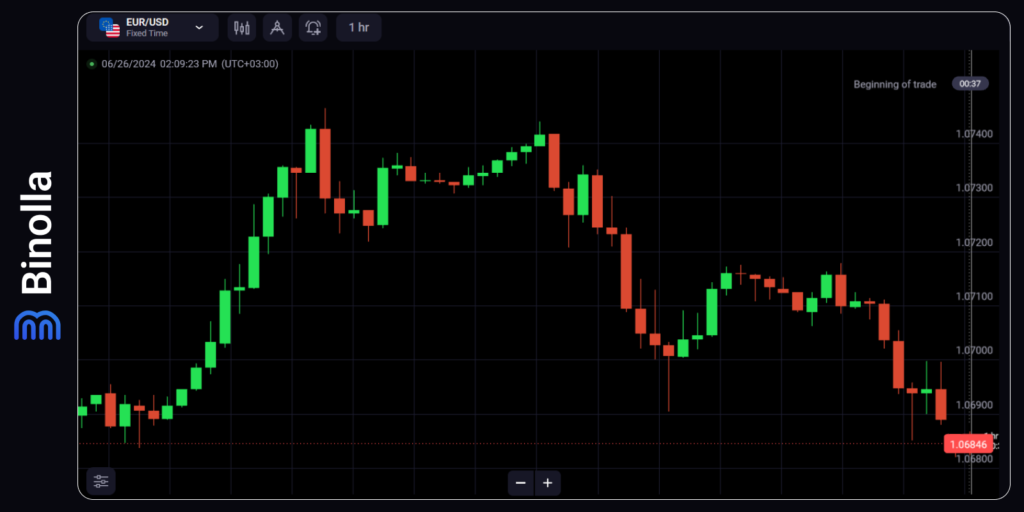
The EUR/USD currency pair moved upward for a while showing a strong uptrend movement. Later, it stopped and reversed. This example is interesting because of one feature. The reversal here wasn’t done at once. After the first peak, the price corrected, but bulls managed to push it higher to make another test of the resistance level. Only after the peak was hit for the second time, the price finally reversed.
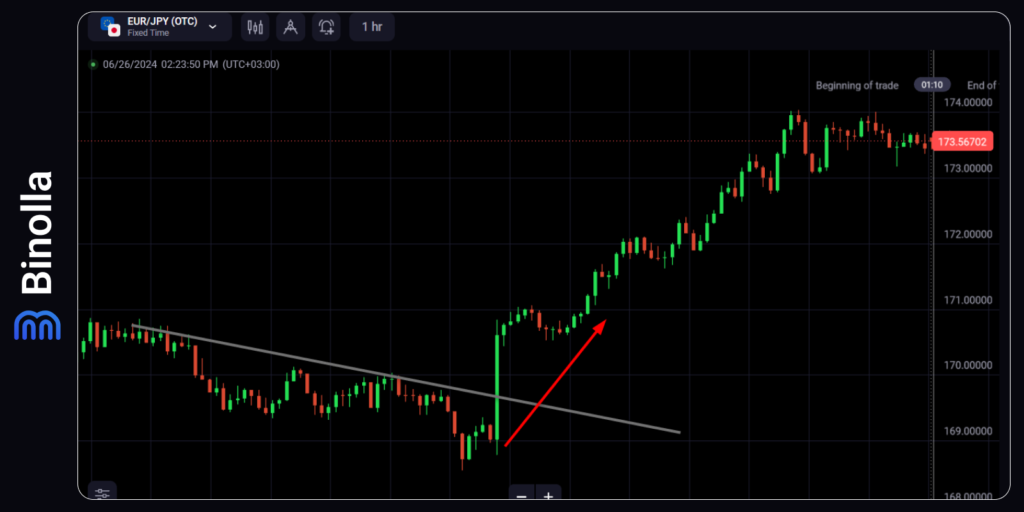
Now let’s consider another situation. The EUR/JPY currency pair moved below the trendline for a while. However, at some moment, the price breaks the trendline and moves higher. Here we can say that a reversal took place as the downtrend is no longer relevant.
How to Find Reversals in Trading
First, you should know how to find reversals in various charts. Some of the most popular ones include:
- Finding trends using technical indicators. This is one of the most popular ways of identifying trends as a trader needs almost nothing to do. They should choose an indicator and add it to the platform. Once everything is done, a trader should simply check the indicator and see possible reversals;
- Identifying reversals using various price patterns. Both candlestick analysis and graphic patterns can be used by traders to find price reversals. To use this method, it is recommended to learn more about such models. The most popular ones are described in our blog;
- Trendlines to see reversals. One of the basic ways to find reversals is to use trendlines. Once the price breaks a trendline and the breakout is confirmed, you can expect the price to change its direction.
With these tools, one can quickly identify market reversals. Now we are going to show you some basic reversal trading strategies for different types of financial instruments.
Basic Strategies for Finding and Trading Reversals in Digital Option, Forex and Stock Trading
There are plenty of reversal strategies that one can use in trading nowadays. Moreover, a trader can create their own ones based on various technical analysis tools. We are going to provide you with some basic tactics that will allow you to start making money in different financial markets. In addition, you can also use these strategies to build your own systems and even combine them to increase your chances for success.
A Strategy Based on RSI
The RSI indicator or the Relative Strength Index was created by Welles Wilder to measure the speed and strength of price recent changes. This momentum indicator is often used by market participants to highlight the overbought and oversold areas. Here is how one can use this tool to identify reversals and trade them.
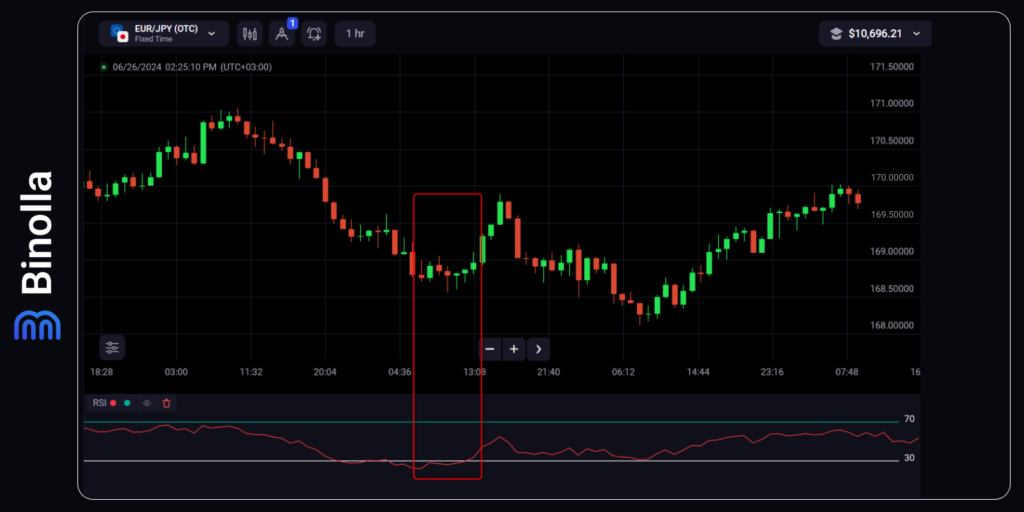
The first example concerns the cases when the RSI indicator is below 30 (the indicator is in the oversold area). For a trader, this means that the price may reverse or at least stop for a while and begin a correction.
Digital option traders can use this situation and buy a Higher contract at the moment when the indicator live breaks above 30. When it comes to FX traders, they can buy a currency pair, stock, cryptocurrency or other asset in this case.
Forex traders should also think about protecting their risks properly. They can use the lowest point of a series of candlesticks to set a stop loss. Alternatively, they can make calculations and place a stop loss at a comfortable distance.
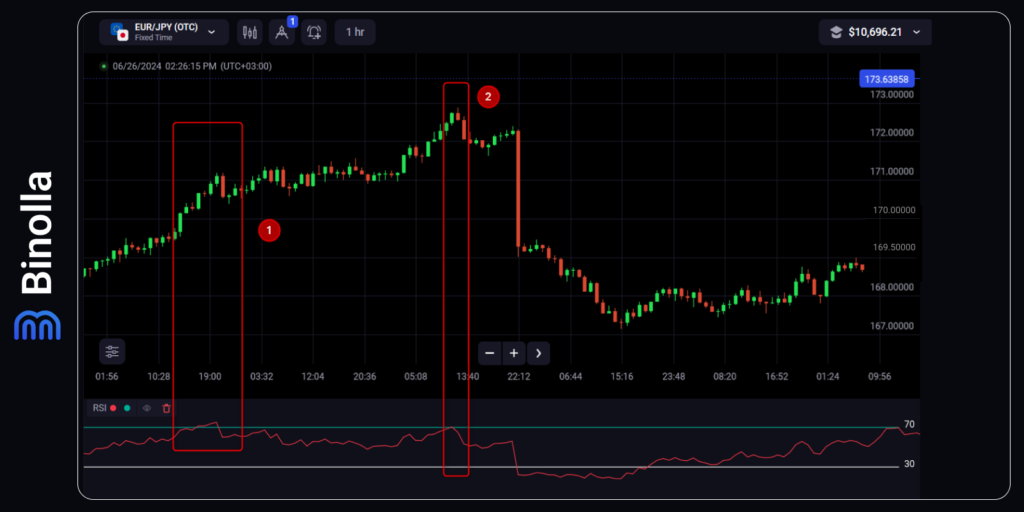
Another example of working with this indicator is when the RSI jumps over 70 for a while and then moves back below this level. The area above the 70 level is known as overbought, which means that the possibility of the price to reverse becomes higher.
Digital option traders can buy Lower contracts in this case. The signal comes right at the moment when the indicator red line breaks below 70. When it comes to Forex traders, the can sell a currency pair, stock, cryptocurrency or other asset at this very moment.
What an FX trader should focus on at this moment apart from pressing the Sell button? Risk protection is among the key necessities that should be done when placing a trade. To set a stop loss, a trader can choose the highest point or the local high.
This example contains two cases when the RSI line breaks below 70. In the first one, we have a brief correction instead of a full-fledged reversal. This is what we have already mentioned previously. If you buy a Lower digital option with an expiration that will take place when the next candlestick closes, you will profit.
Forex traders will also be able to close the trade after the red candlestick and gain some money. However, for those FX traders who are looking for more considerable price movements, this situation can end in losses as the price resumes the uptrend and moves higher until the second signal appears.
The Double-Top Trading Strategy
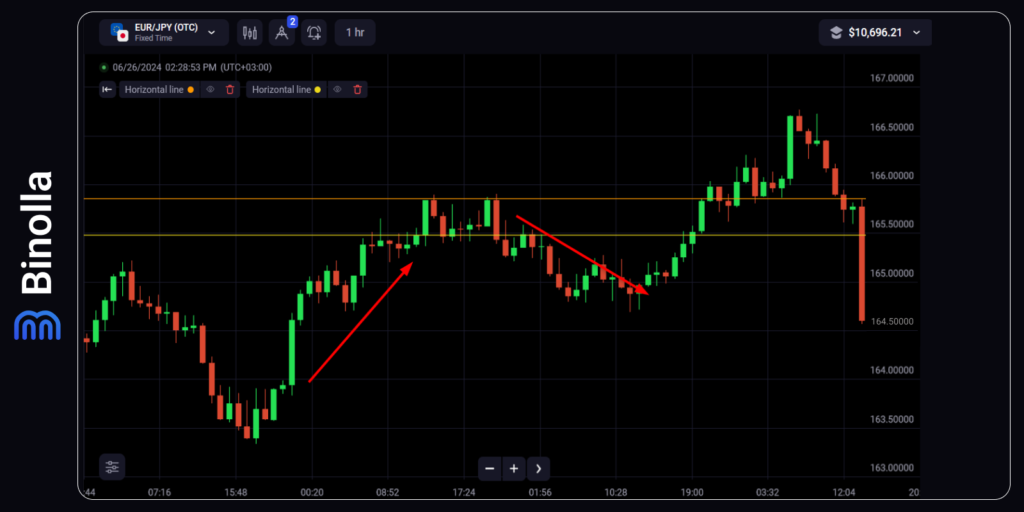
Trading with technical indicators is not the only way for a trader to find reversals. In the example above, we have a graphic pattern known as double top, which allows market participants to forecast future price reversal.
The double top pattern consists of two tops (as it comes from its name) that are linked by a horizontal line. There is also a neckline, a horizontal line below the level connecting two highs. As you can see, after testing the first top, the price moves lower to the neckline and then goes back to the second top.
The signal comes when the price breaks the neckline. Digital option traders buy Lower contracts in such cases. FX traders sell a currency pair, stock, cryptocurrency, or any other asset they trade. Moreover, for Forex CFD traders it is important to set stop losses when trading reversals. The best option is to set stops somewhere above the resistance line. If one of the candlesticks’ tails goes above the resistance line, a trader can place a stop loss right above its highest point.
The Double-Bottom Trading Strategy
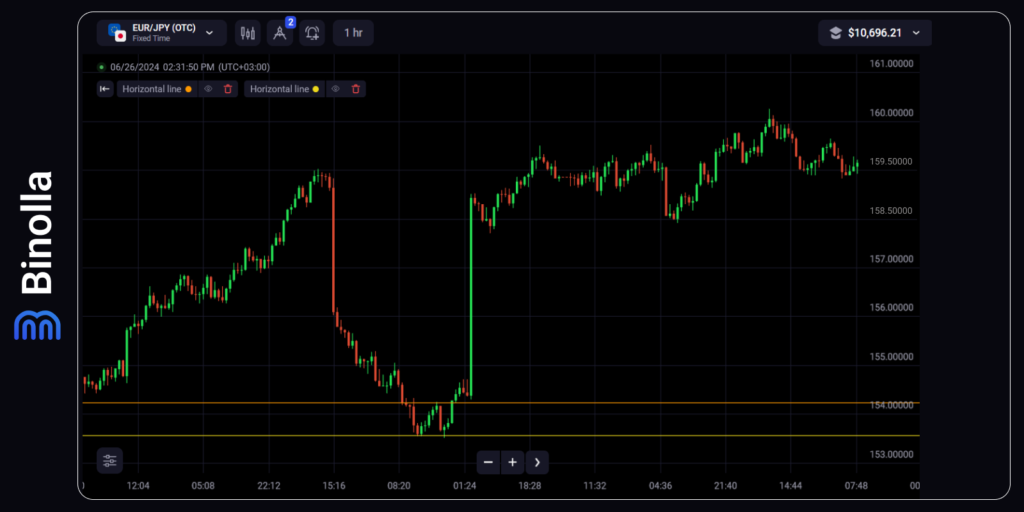
Let’s move on with the next example of the basic reversal strategy in digital options trading. Here we have a so-called “double bottom” pattern, which is formed by the two lowest price points. Similar to the previous one, this pattern has a neckline, which is above the support level formed by the two bottom lines. When the price fluctuates between the lowest extremes, the neckline prevents it from getting higher.
The signal appears when the neckline is broken. Digital option traders buy Higher contracts at this exact moment. Forex traders buy an asset once the neckline is surpassed by the quotes. Those who trade CFDs should think about protecting their trades. A stop-loss order can be placed below the support level connecting the two lowest points of the pattern.
Reversal Strategies Using Candlestick Patterns
A whole palette of candlestick reversal patterns is available to traders nowadays. You can use any of them to find reversals and capitalize on such market situations. Here are a couple of examples that help you better understand how to apply such a method to your trading routines.
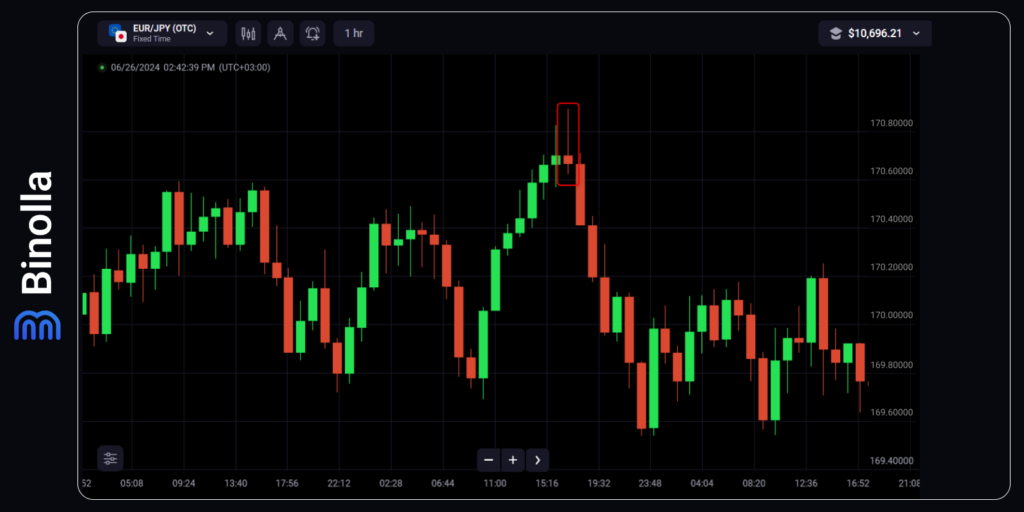
The first example covers a situation when a shooting star pattern appears in the chart. Once the red candlestick with a long tail appears, a trader can buy a Lower contract. Forex CFD traders sell an asset at this moment. Stop losses can be placed above the highest point of the signal candlestick.
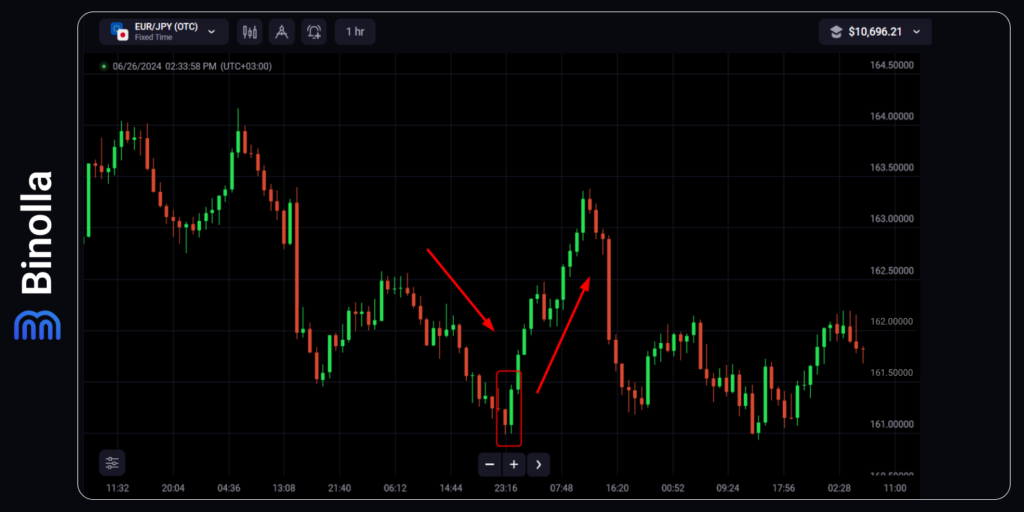
Let’s now move to the second example and see how we can find reversals when the downtrend is over. The image above illustrates an engulfing pattern where the first red candlestick is engulfed by the second green one. Once the green is closed a digital option trader buys a Higher contract. Forex CFD traders buy an asset. To protect their trades, FX traders can place stop losses below the lowest point of the pattern.
Trendline Reversal Strategies
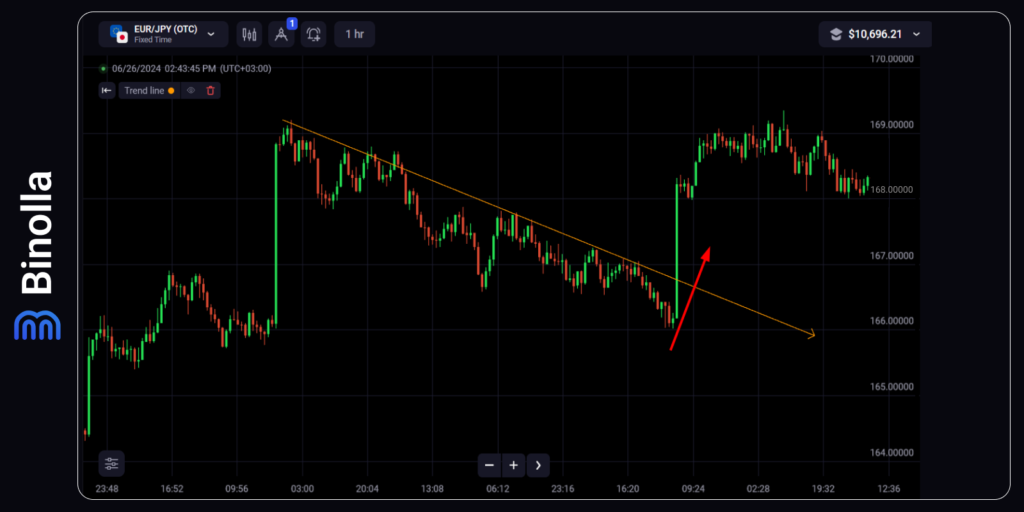
Last but not least come strategies that use trendlines. The idea behind them is very simple. A trader can find a signal once a trendline is broken by the price. Those who trade digital options will buy Higher contracts in this situation while Forex CFD traders purchase an asset. A stop loss for FX traders can be place below the trendline.
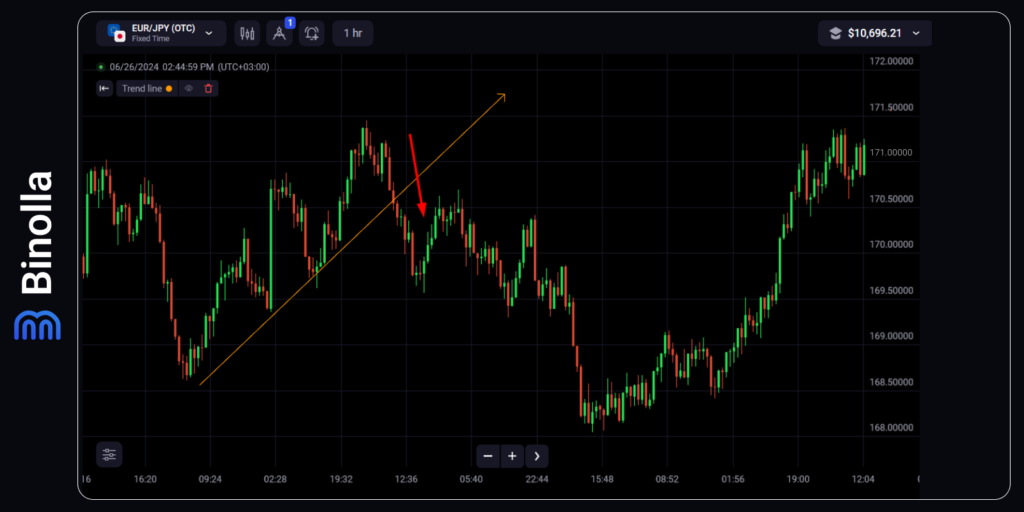
A similar strategy can be applied by traders when the price pushes below the ascending trendline. Here is an example of how to behave in this situation. A digital options trader buys a Lower contract, while an FX trader sells a CFD. Stop losses can be placed above the trendline at this time.
Key Recommendations to Consider When Using Reversal Strategies
To trade reversals even more effectively, one should pay attention to some recommendations listed below:
- Use reliable technical indicators. The most popular indicators for reversal trading are RSI, Stochastic, and MACD. Look for oversold and overbought areas as well as check divergences;
- Check the current market volume. This is relevant mostly for stocks and other exchange-traded assets where you can find pure trading volumes. Reversals are accompanied by increased volumes in most cases;
- Use protection orders. Using stop losses for CFD traders is crucial as it protects them from excessive risks. Most reversal strategies allow you to find where to place a reliable stop loss;
- Confirm trading signals. All trading signals that come from various strategies require confirmation. Use additional technical analysis tools to make sure that reversal is taking place;
- Various timeframes. When trading digital options of Forex CFDs it is crucial to switch between different timeframes to see major and local trends and forecast reversals;
- Keep an eye on the news and fundamentals. Being informed about the events that may cause significant price fluctuations is vital for both digital option and Forex traders. Check fundamentals from time to time to make sure that your current position aligns with the fundamental trends.
FAQ

What Is a Reversal in Trading?
Reversals in trading mean a change in the current trend. For instance, when the uptrend ends, a downward reversal takes place, while once the downtrend is over, the upside reversal occurs.
What Indicators Digital Option Traders Use to Identify Reversals?
Common indicators that most digital options traders use to find reversals include RSI, Stochastic, Bollinger Bands, Keltner Channel, MACD, and others.
Is Volume Important to Find Price Reversals?
Volume is one of the key factors when identifying reversals. However, this works better for assets with pure market volumes such as stocks that are traded on a particular exchange. When it comes to currencies with tick volumes, results may vary.
What Are the Most Popular Candlestick Patterns for Seeing Reversals?
The most popular reversal patterns include the hammer, inverted hammer, shooting star, hanging man, engulfing (both bearish and bullish), marubozu, and many others.


