Line Charts: All You Need to Know About

Line charts are not very popular among traders. You wouldn’t believe it, but a couple of decades ago, these charts were dominant in the niche. However, with the discovery of Japanese candlesticks, the situation has drastically changed. Nowadays, Asian charts are the most popular among traders and investors, while the line chart is a true outsider. However, we do not agree with this position. Line charts have their own benefits that you will discover in this article. Also, you will learn more about how to read line charts in Forex trading.
Contents
Line Charts Explained
The line chart graph in Forex is the basic type of chart, which represents a price line. The next part of the line is the closing price. Therefore, by using this type of chart, you will always see the current price of the asset, be it a currency pair or a stock. To start trading with lines now, create an account at Binolla.
To be more precise, a line is a set of points that are connected to each other. With only one type of price involved, they reduce market noise and allow you to have a clearer picture of what is happening in the market.
Charles Dow, the godfather of technical analysis, was interested in closing prices only. He believed that looking at highs and lows for a particular period makes it even harder to analyze price fluctuations.
How to Add Line Charts to Binolla
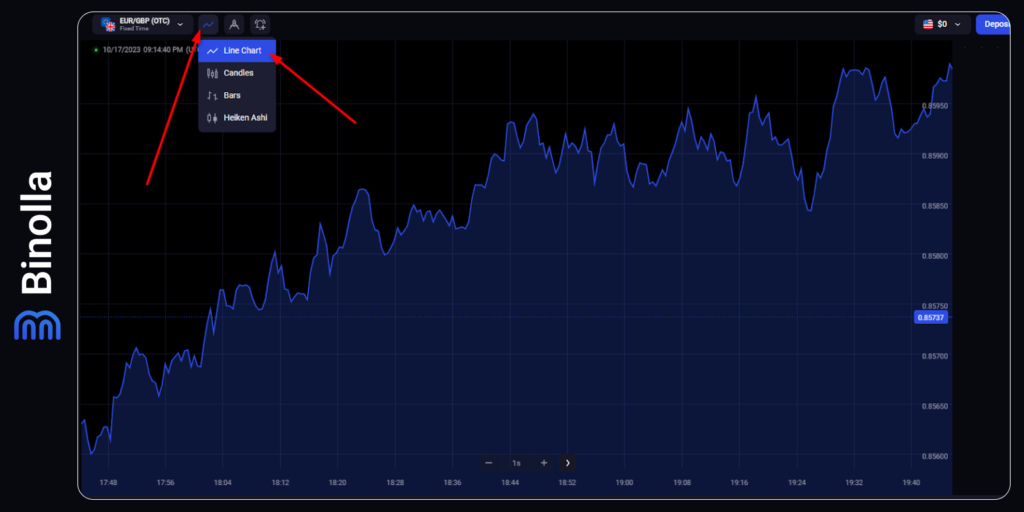
The Binolla platform offers all popular types of charts, including lines. To choose this type, you should complete the following steps:
- Go to the platform and log in to your account.
- Move the cursor to the top part of the platform and click on the icon with charts.
- Choose Line Chart there and click on this submenu.
That’s all. Now you have Forex line charts installed on the platform and you can use them to the fullest.
Line Charts vs. Japanese Candlesticks
The difference between Japanese candlesticks and line charts is that Japanese candlesticks show more information than line charts. Line charts only connect the closing prices of each period, while Japanese candlesticks show the opening, closing, high, and low prices of each time period. They also use colors to indicate whether the price went up or down in each period.
Japanese candlesticks are more visual and detailed than line charts. They can help traders identify patterns, trends, reversals, and signals in the price movement. However, they can also be overwhelming and confusing for some traders who prefer a simpler and clearer view of the market. Line charts can filter out the noise and show the general direction and flow of the price over time. They are easier to follow and understand, especially for beginners.
Both types of charts have their advantages and disadvantages, depending on the trader’s style, preference, and objective. Some traders use both types of charts in combination to get a better perspective on the market. For example, they might use a line chart in technical analysis for a higher time frame analysis and a candlestick chart for a lower time frame analysis.
How to Trade Using Line Charts
While Forex line charts may seem primitive and lack information about the price, this is a powerful tool with a lot of unexpected positive surprises inside. One of the advantages of this type of chat is that it reduces noise, which can be used in a variety of ways when you want to see the pure price.
Forex Line Chart Strategy with Trendline
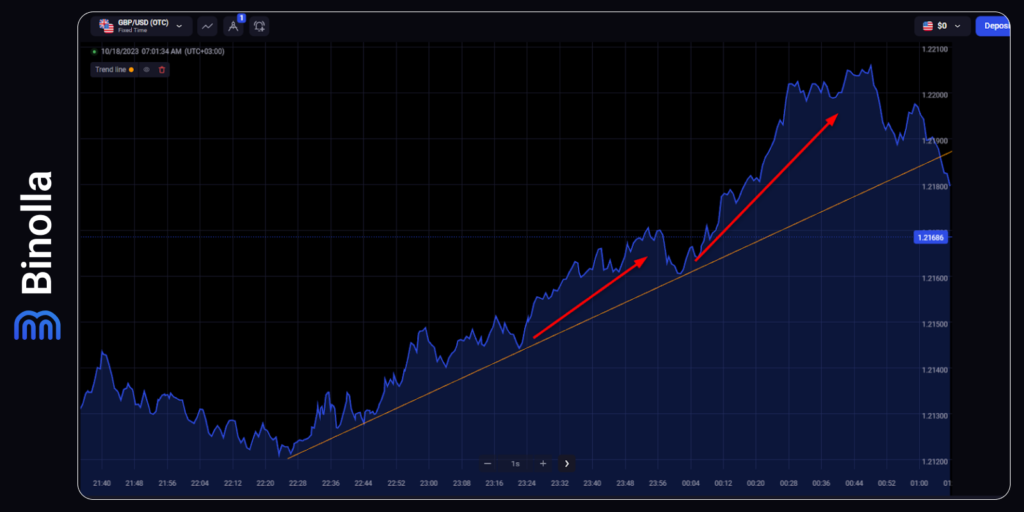
The first Forex line chart strategy uses the combination of a line chart and a trendline. This system is very simple to understand. While the price goes above the trend line, you can buy Higher contracts or simply buy Forex assets or stocks. As for exact entry points, you can use the moments when the price hits the trend line and reverses from there.
If you need to place a stop loss (when trending currency pairs or stocks), you can do it below the trend line. For price targets, you can use the trendline again. Hold the trade until the priceline stays above the trendline.
Line Chart+Trendline Breakout Strategy
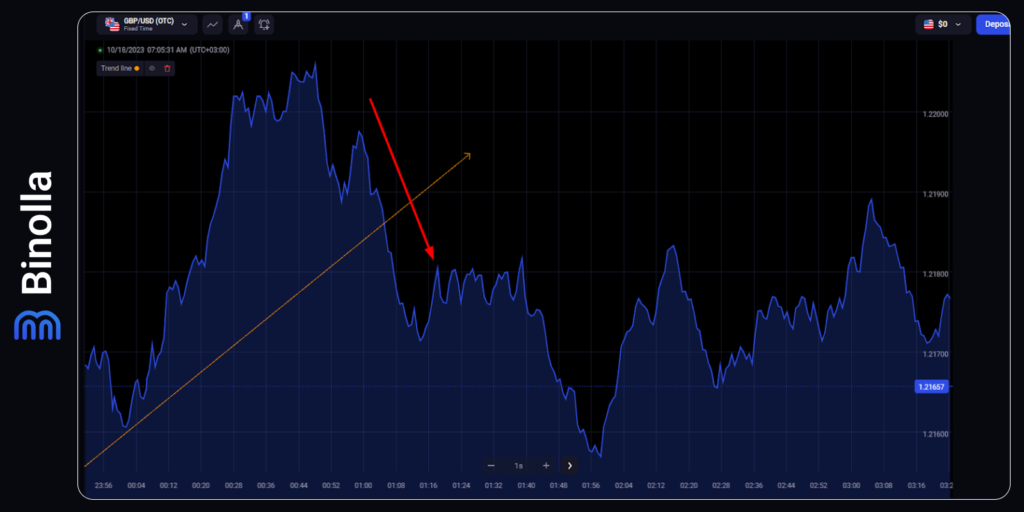
Another strategy that you can use when trading online charts is one where the price makes a breakout. You can see the same trendline in the example that we have illustrated above. This time, the price breaks the trendline from above at some point instead of rejecting it.
Digital options traders can use this situation to buy a Lower contract, while FX and stock traders can simply sell an asset. This is a short-term strategy that uses the momentum that the price has after it breaks the trendline. However, if you see that the downtrend is going to develop, you can hold your positions for longer.
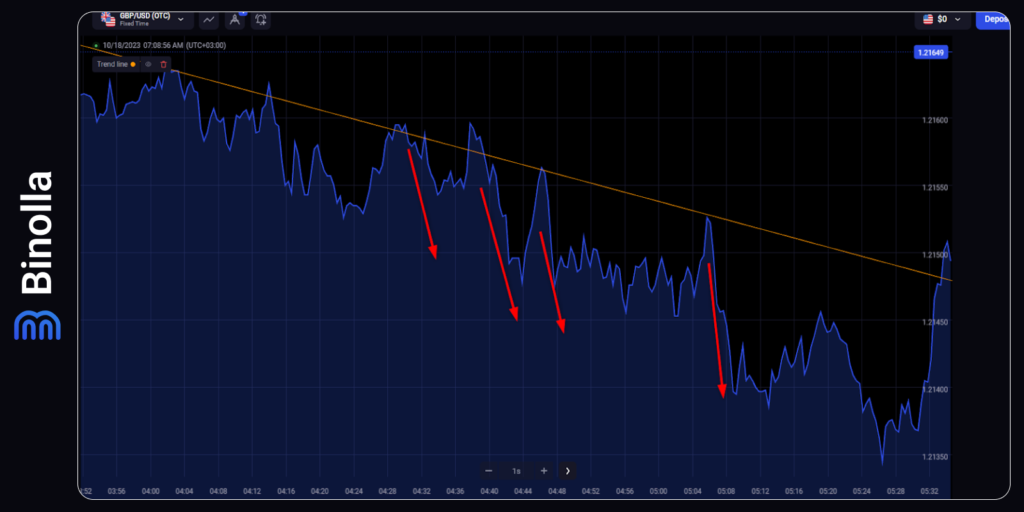
The next example that we would like to show is when the price goes into a downtrend. There is a descending trendline, which rejects the price many times, and you can use this opportunity to buy Lower contracts or sell a currency pair.
What this and other previous strategies lack is the possibility to use the chart to watch for confirmations.
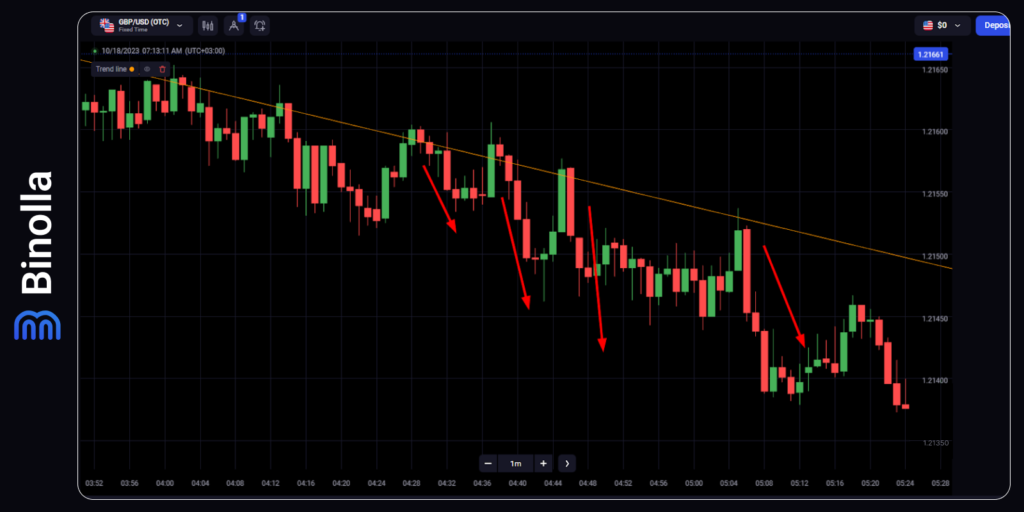
If we go back to Japanese candlesticks, we will see that, along with more informativeness, this chart provides you with additional signal confirmations, which may help you make the right and timely decisions about the local swings.
Line Chart Range Strategy
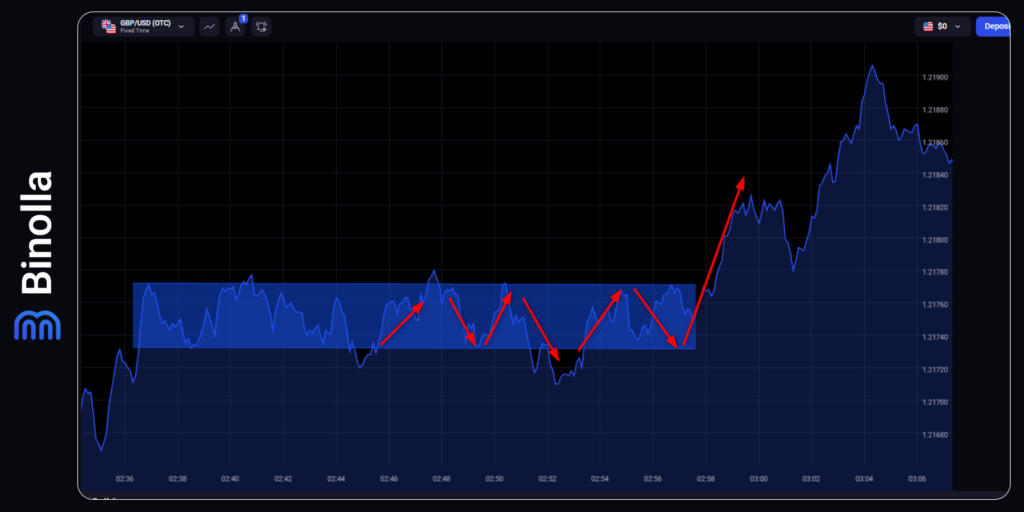
The next strategy that we are going to consider is trading within a price range. While the price stays within boundaries, you can buy Higher or Lower contracts, depending on the situation. In particular, once it rejects the lower line, you can buy Higher contracts, while after it hits the upper band and reverses, you can purchase Lower contracts.
When it comes to Forex or stock traders, you can buy and sell when the price jumps off the boundaries. As for stop losses, when you buy, you can place it below the support level according to your risk expectations, while when you sell, you can place a stop loss above the resistance level.
When calculating your eventual profits, you can look at the distance between the support and resistance levels.
The price never stays in a range for long; that’s why you should prepare for it to leave the corridor and be ready to buy or sell at this exact moment. The breakout strategy is also very simple. When you see the price going outside the support or resistance level, you should take action right away. A stop loss may be placed within the range.
Head and Shoulders Pattern
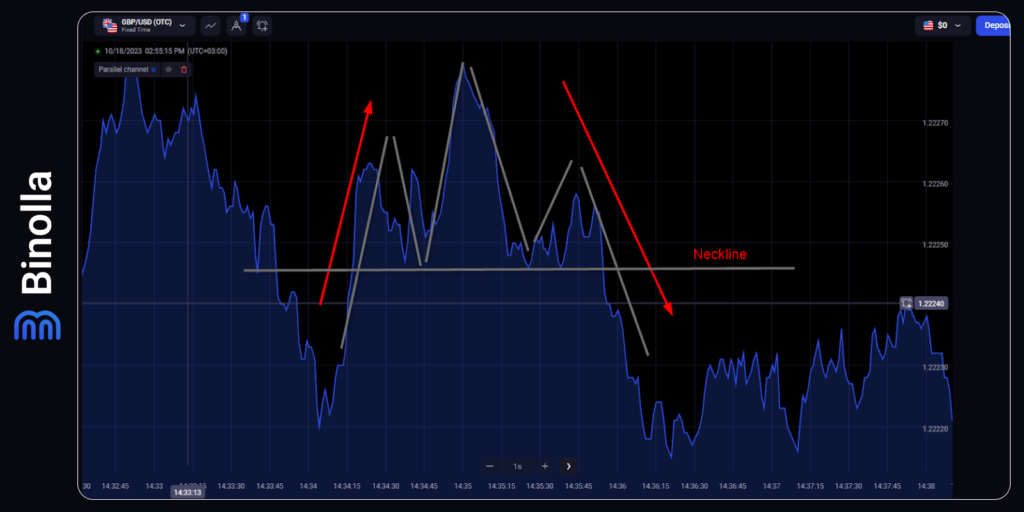
Traders often use line charts to “diagnose” various price patterns. There are plenty of such models that may appear, including the Head and Shoulders pattern that is presented in the screenshot.
To trade it, you need to wait until the price completes all the “hills” and breaks the neckline from above. Traders should sell a currency pair or a stock, or buy a Lower contract in this case.
Along with the Head and Shoulders pattern, which is a pretty rare guest on charts, there are a lot of other models that can be found on charts, including double and triple tops, double and triple bottoms, triangles, diamonds, and many others.
Forex Line Charts Pros and Cons
Forex line charts, also known as line graphs or simply line charts, are a popular way of visualizing price data in the foreign exchange (Forex) market. Like any charting method, it comes with its own set of pros and cons. Here’s an overview of the advantages and disadvantages of using Forex line charts:
Pros:
- Simplicity. Line charts are incredibly straightforward. They connect closing prices over a period of time with a simple line, making it easy for traders, especially beginners, to grasp the overall price trend;
- Clarity. These charts help traders identify the long-term trend and major turning points in the Forex market, making them suitable for investors with a longer time horizon;
- Reduced Noise. Line charts filter out some of the minor price fluctuations and noise that are present in more complex chart types like candlesticks or bar charts. This can make it easier to see the bigger picture;
- Ease of Use. Line charts are easy to create and understand, making them accessible to traders who may not be familiar with more intricate charting techniques;
- Historical Overview. They provide a clear historical overview of price movements, which can be valuable for long-term analysis and identifying key levels of support and resistance.
Cons:
- Limited Information. Line charts only display closing prices, omitting essential intraday information such as the high, low, and open prices. This limitation can hinder a trader’s ability to make informed decisions;
- No Real-Time Data. Since line charts only update when a new closing price is available, they don’t provide real-time information about market dynamics, which is crucial for active traders;
- Inefficiency for Short-Term Trading. For short-term or intraday traders who need to make quick decisions, line charts may not provide sufficient detail or granularity to analyze price movements effectively;
- Lack of Pattern Recognition. Line charts do not represent chart patterns like candlestick charts, which can be essential for technical analysis. Traders who rely on patterns may find them less useful;
- Reduced Precision. When price movements are small or occur within a short time frame, line charts may not capture these fluctuations adequately, potentially leading to missed trading opportunities;
- Lack of Market Sentiment. Line charts do not convey market sentiment as effectively as candlestick charts or other more comprehensive chart types, which can be critical in Forex trading.
Forex Line Charts Tips and Tricks
Forex line charts are simple yet effective tools for visualizing price trends over time. Here are some tips and tricks to help you make the most of using line charts in your Forex trading:
- Understand the Basics. Before diving into line charts, make sure you understand the fundamental concepts of Forex trading, including how to read currency pairs and interpret price movements;
- Identify Key Levels. Use line charts to identify significant support and resistance levels. These are price points at which the market tends to react, providing potential entry and exit points for your trades;
- Combine with Other Tools. Line charts are often more powerful when combined with other technical analysis tools, such as trend lines, moving averages, or oscillators. This can help confirm trends and potential reversals;
- Practice Patience. Line charts in Forex trading are excellent for long-term trend analysis, but they may not be as helpful for day trading or scalping. Be patient and consider the appropriate time horizon for your trading strategy;
- Use Trendlines. Draw trendlines on your line chart to visually represent the direction of the trend. A trendline connecting higher lows in an uptrend or lower highs in a downtrend can help you identify trend direction;
- Spot Chart Patterns. While line charts don’t display specific chart patterns like candlestick charts do, you can still identify basic patterns like head and shoulders or double tops/bottoms by examining the line’s shape.
Conclusion
Forex line charts are a great solution for traders who want to have less information about the price and see clearer and less noisy fluctuations. You can use this type of chart together with price patterns, indicators, and other tools.
FAQ

What is a Forex line chart, and how does it work?
A Forex line chart is a graphical representation of currency pair price movements over a specified period. It connects closing prices at regular intervals with a simple line. Each point on the chart represents the closing price at that time. By connecting these points, you can observe the overall trend and direction of the currency pair.
How do I read and interpret a Forex line chart?
Reading a line chart is straightforward. The line typically moves from left to right, indicating the price direction. An upward-sloping line suggests an uptrend, while a downward-sloping line indicates a downtrend. The steepness of the line can give an idea of the strength of the trend. You can also identify support and resistance levels where the line reverses direction.
Are line charts suitable for short-term trading strategies?
Line charts are better suited for longer-term trading and investment strategies. They provide a broad overview of price trends but may not capture the necessary details for short-term trading, such as intraday price fluctuations. Traders often use other chart types, like candlesticks or bar charts, for short-term analysis.
Can I use indicators and overlays with line charts?
Yes, you can use technical indicators and overlays in conjunction with line charts to enhance your analysis. Common indicators include moving averages, trendlines, and oscillators. These tools can help confirm trends, identify potential entry and exit points, and provide a more comprehensive view of the market. However, it’s essential to choose indicators that align with your trading strategy.


