EUR/USD Stays Above 1.0800 on the Eve of Eurozone’s and US Key Macroeconomic Data

EUR/USD stays slightly above 1.0800 ahead of important data releases from the Eurozone and the US. The US dollar index has crossed another important resistance level and is nearing 104.70. The key event this week is the FOMC meeting. While there are almost no doubts among economists and investors about the decision, it is recommended to listen to the commentaries during the press conference, which may shed light on future steps.
The Fed is expected to pivot to monetary policy easing in September. According to the CME FedWatch tools, economists and investors expect the Fed to cut rates starting from its first meeting in autumn. Moreover, we expect the FOMC to make another cut this year somewhere in November-December.
When it comes to the Eurozone’s data, it is worth mentioning German and aggregate inflation releases on Tuesday and Wednesday. Economists expect the Eurozone’s yearly inflation to slow down from 2.9% to 2.8%.
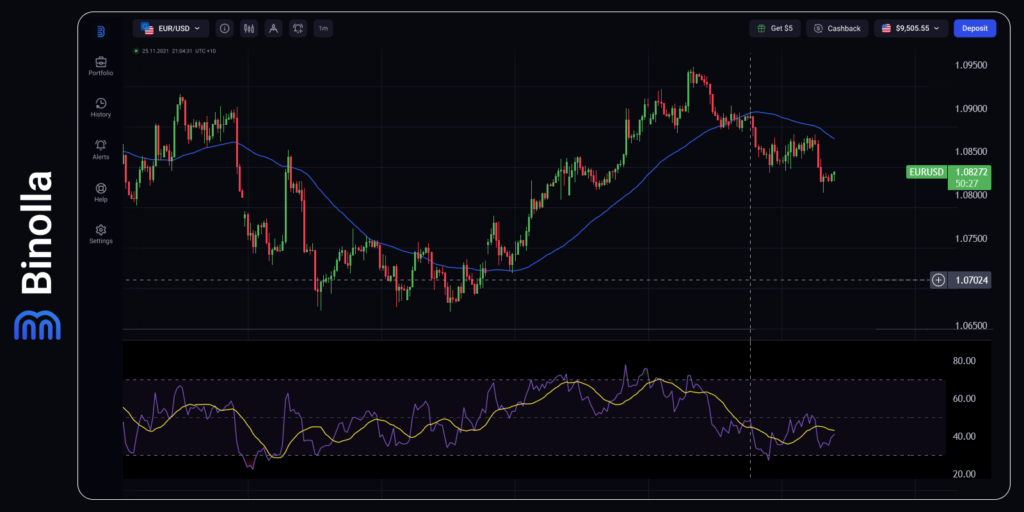
On the technical side, EUR/USD has just switched to a downtrend last week after testing 1.0950 on Wednesday, July 17. Currently, the currency pair stays below the SMA 50 and tested it on Monday. However, another upside correction may take place as a new local low was just reached.
When it comes to RSI, the indicator shows no signals currently, but the line is close to its bottom 30 line. The closest support is at 1.0800. After breaking it, EUR/USD is likely to move towards 1.0770, which is the next local support. The upper target is the SMA 50 and 1.0860, which is the closest resistance level.
Contents
GBP/USD Struggles to Grow as the US Dollar is on Top
Similar to EUR/USD, GBP/USD stays close to its local lows on the eve of the FOMC meeting. Moreover, another factor holding back growth is the upcoming Bank of England meeting that will take place on Thursday. According to forecasts, the BoE will unanimously accept the first rate cut from 5.25% to 5.00%.
Moreover, traders and investors anticipate Wednesday’s FOMC meeting to learn about the upcoming Fed’s steps. While there are no expectations that the FOMC to cut rates in July, the Fed is likely to make the first expansionary step in September 2024.
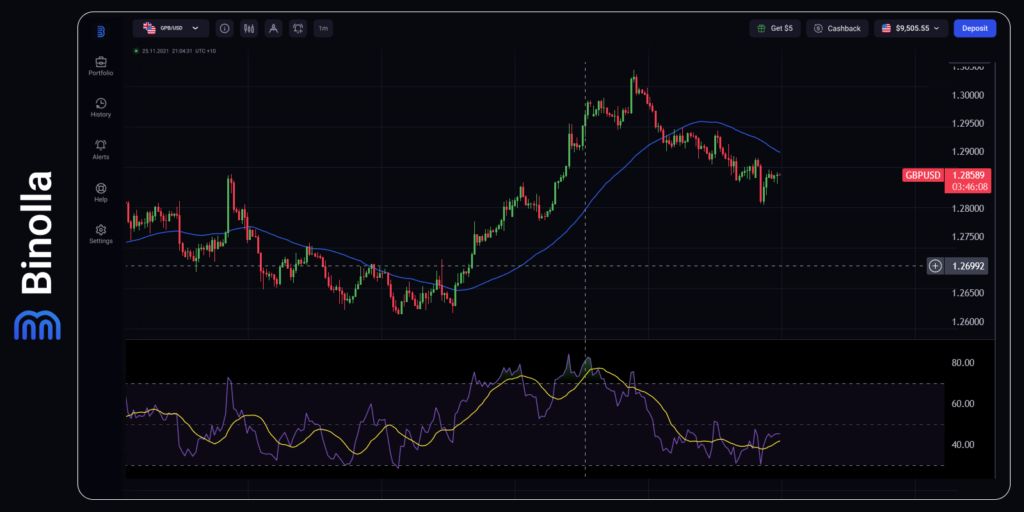
GBP/USD changed its direction last week and bears are trying to push the currency pair lower to 1.2610, which is the close major support level. The currency pair is trading below the SMA 50, which acts as a dynamic resistance level. There were a couple of attempts to test it already, but they failed and GBP/USD moved lower.
The RSI indicator is neutral as the line is above 30, but shows no direction at the moment. The closest support level is at 1.2809. The currency pair stays close to the upper line of the downside channel, which means that it is likely to test this support in the upcoming hours.
AUD/USD Makes a Recovery on the Eve of Australian CPI Data
AUD/USD traders are waiting for Wednesday’s Australian CPI data. According to forecasts, quarterly inflation is expected to be unchanged, while yearly inflation is likely to slow down from 4.0% to 3.8%. While it is not enough for the RBA to consider any monetary policy easing, further inflation deceleration may be a signal to market participants that the Reserve Bank of Australia will be ready to switch the monetary policy to expansionary.
Moreover, similar to other currency pairs, AUD/USD is under pressure ahead of the FOMC meeting. While the first interest rate cut by the Fed in September is no more in doubt, this expansionary step seems to be added to the current price. Moreover, it is worth focusing on the FOMC press conference as the Fed voting members may be more clear about their monetary policy projections for 2024.
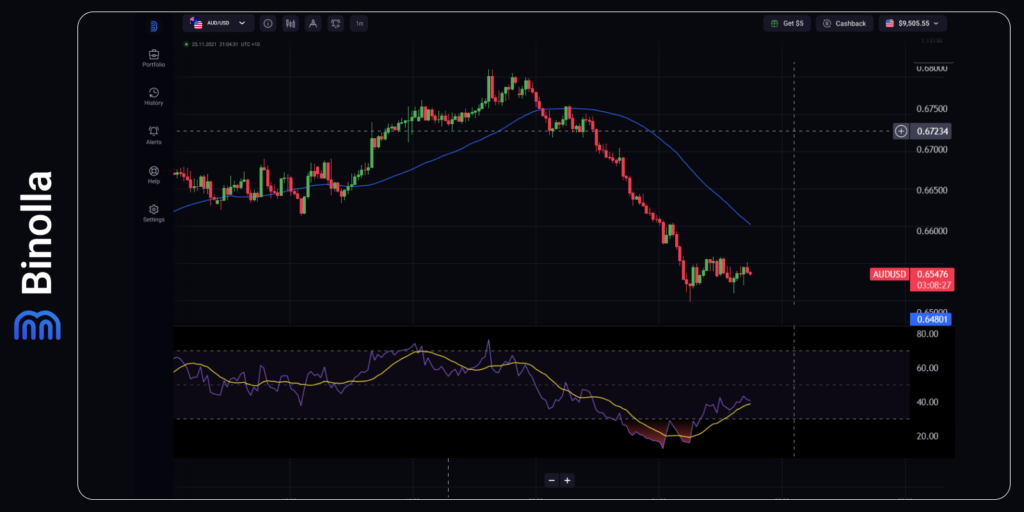
On the technical side, AUD/USD has made a long road down and stopped at 0.6530. While there is no clear reversal and the currency pair is stuck in a small price range, the further downtrend is under question at the moment.
We have already mentioned 0.6530 as a support level that prevents the price from going lower. However, if AUD/USD breaks this line, the next support will be at 0.6470. As for resistance, bulls have made an attempt to break above 0.6568, but failed, which means that the line is still relevant. If buyers manage to push the price higher, the next support level will be at 0.6610. Keep in mind that the SMA 50 acts as a dynamic trendline and exerts additional pressure on AUD/USD.
XAU/USD Departed from ATH as the US Dollar Index Surges
The precious metal reached its ATH in July 2024, but with the growing risk appetite, XAU/USD failed to hold its position there. Gold reversed from its highs and started a correction that may turn into a full-fledged downtrend.
The main question that traders should consider is whether the Fed is going to cut rates at least twice this year. Moreover, market participants should also pay closer attention to the upcoming US elections which may both stimulate further risk appetite or make investors seek to shelter in safe-haven assets such as gold.
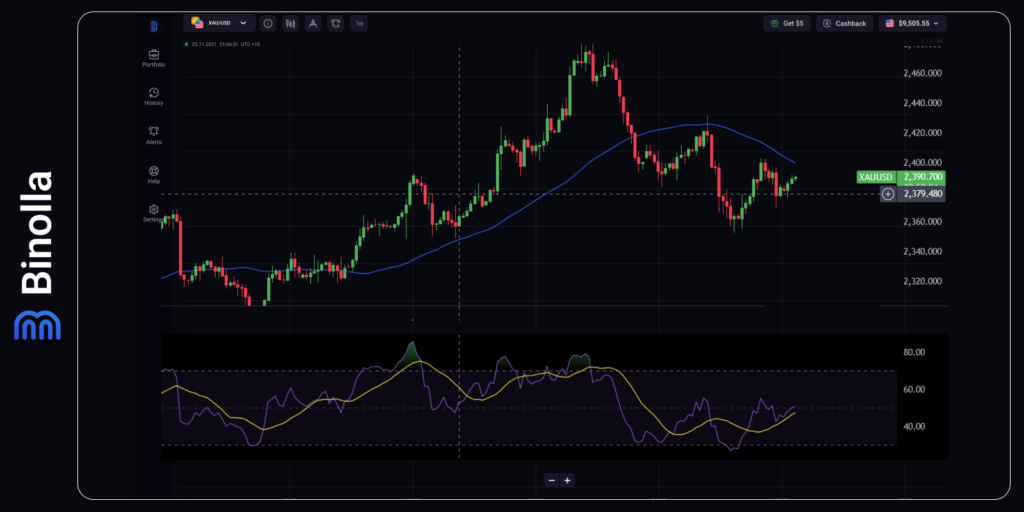
The 4-hour XAU/USD chart demonstrates a clear downtrend after a couple of attempts to break higher when the price reached its ATH. XAU/USD stays below the SMA 50, which is a dynamic descending trendline. The RSI indicator is looking upwards, but further price movement direction will depend on whether XAU/USD manages to break the SMA 50 and move higher or not.
The closest support level is at 2,360. By breaking it, XAU/USD is likely to move towards 2,320. On the upside, the closest resistance level is at 2,400, which is a kind of round psychological level. By breaking it, gold is likely to move towards 2,420.
Brent Crude Oil is on Defensive
The crude oil price is under pressure as tensions in the Middle East are not among the top priorities currently. Traders and investors pay more attention to the upcoming Fed decisions and the US elections. Moreover, seasonal demand is mostly over as the last summer month is already on the threshold.
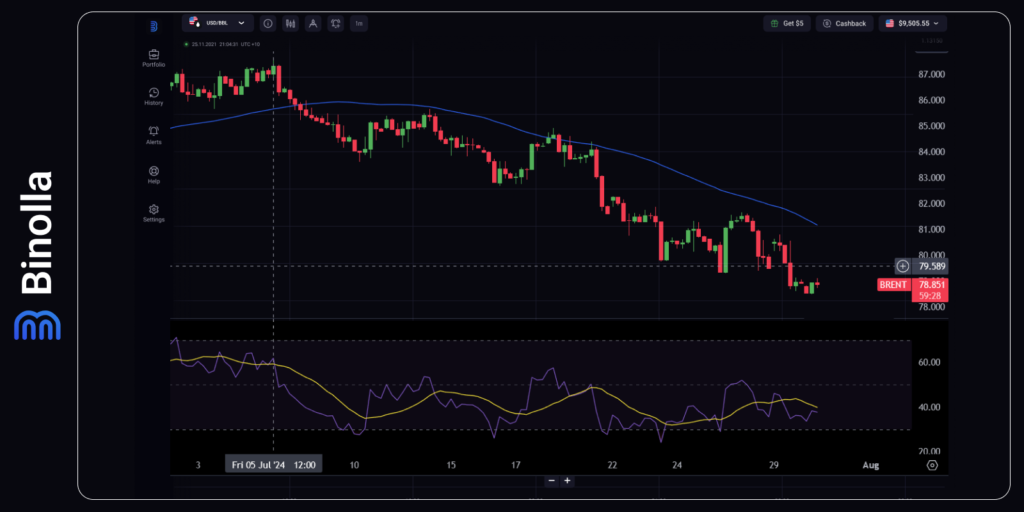
The crude oil 4-hour chart demonstrates a downtrend as Brent is below the SMA 50. RSI is neutral, but it is close to 30, which means that a correction may occur in the near future. The price is testing 78.40 currently. The next support level is at 77.00, which is a round psychological number.
On the upside, the next resistance is at 80.20. In case of a correction, we expect the SMA 50 to be close to these levels. If the price breaks it, the next resistance can be expected at 80.60.


