EUR/USD Plunges as the US Labor Market Shows Better Performance

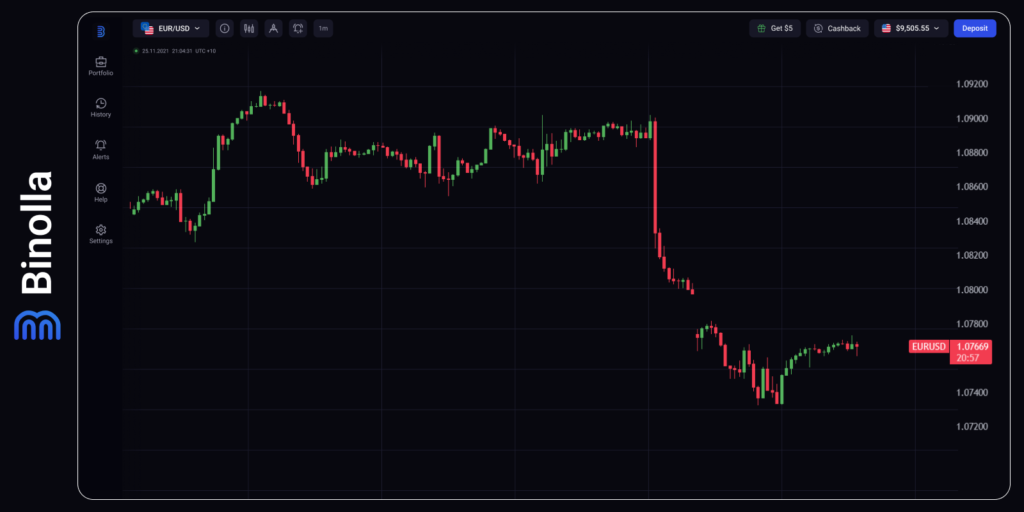
EUR/USD edged higher during the Asian session and managed to test 1.0770. However, this upside correction seems to end and currently, the Euro may resume its downtrend. Both fundamental background and technical setups indicate the probability of another downside round aiming at 1.0730.
The greenback is supported by stronger-than-expected labor market news. US jobs data on Friday was better than expected which, in turn, supports the growing acceptance that the Fed is likely to postpone its first rate cut this year.

Moreover, French President Emanuel Macron has decided to call snap elections later this month, which increases the political uncertainty in this country, which is the second-largest Eurozone economy. All the above supports bearish moods and validates the short-term negative outlook for the currency pair.
EUR/USD plunged below 100-day and 200-day SMA after non-farm payroll data. Both dynamic levels act as resistance levels and any upside movement towards them can be considered as an opportunity for sellers to add to their short positions. However, traders also should consider the possibility of a short-term rally towards 1.0870 with the highest possible local target at 1.0900.
When it comes to targets below current levels, they can be found at 1.0730. The 1.0700 area protects the price from moving lower in a short-term perspective. If both are broken, the next targets may be at 1.0640 or even 1.0600. The latter is the YTD’s lowest point, which reached in April.
Contents
The British Pound is Under Pressure After the US Labor Market Data
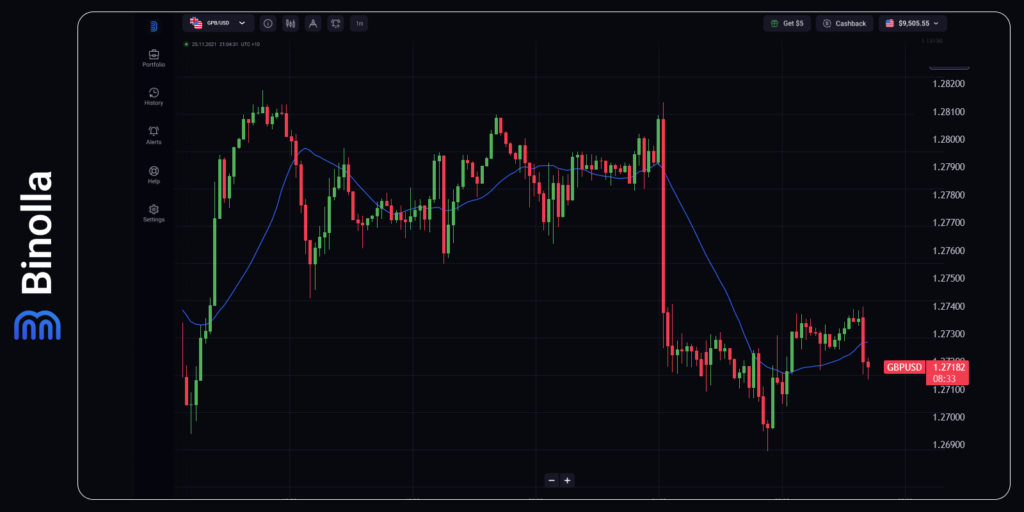
Friday’s labor market statistics from the United States affected the UK pound as well. The currency pair faces selling pressure on the eve of the London session. Poor UK labor market statistics puts pressure on GBP/USD as well. Another important factor supporting USD is the expectation that the FOMC will postpone interest rate cuts.

The unemployment rate in the United Kingdom rose to 4.4%, which is more than the 4.3% expected by economists and investors. The data reflects how businesses struggle to bear the consequences of higher interest rates set by the Bank of England.
Earnings increased by 5.9% from 5.7%. Moreover, wages were higher than forecasted. Higher earnings may prevent the BoE from cutting the rates during the upcoming meeting events.
GBP/USD seems to find interim support at 1.2700 as it is supported by a 20-day moving average. Moreover, the exponential moving average hints at the probability of the short-term uptrend continuing.
AUD/USD Demonstrates Moderate Fluctuations
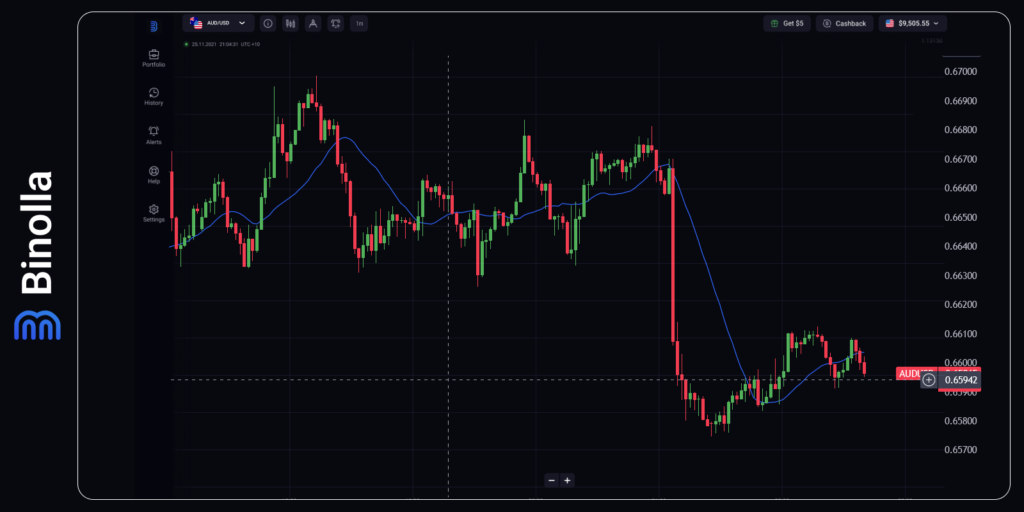
The Australian dollar plunged on Friday after the better-than-expected US labor market data but has shown moderate fluctuations since. While USD is still strong, the Australian dollar made some minor gains. According to the CME FedWatch tool, the likelihood of the rate cut by the FOMC in September has decreased.

On the other hand, traders do not expect the Reserve Bank of Australia to cut rates this year as well. The RBA governor Michele Bullock announced the possibility of maintaining the rates higher this year if the CPI index is unable to reach 1%-3%.
Technically, the Australian dollar stays close to 0.6590. While AUD/USD restored since Friday, the bullish momentum is weak. Key support levels are at 0.6550 and 0.6000. If AUD/USD manages to break below these areas, the next support will be at 0.6470.
Conversely, the upside is limited at 0.6625, which is the closest key resistance. If AUD/USD manages to break this level, the next level to hold bulls will be at 0.6700.
Gold Is on the Defensive Amid Fresh US Labor Market Data
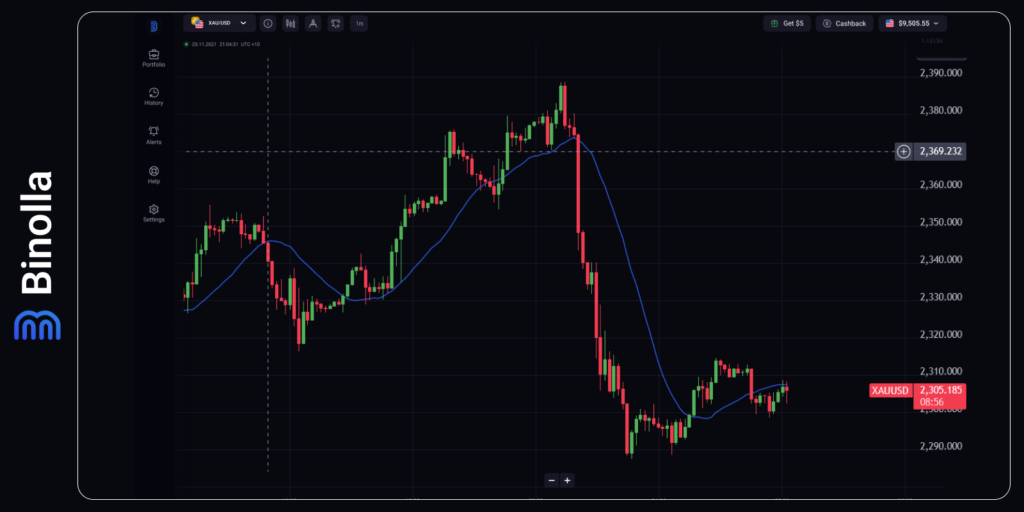
XAUUSD had a downside correction early European session and found a supply after a modest recovery from Friday’s sharp plunge in reaction to the US job data. Gold managed to make a slight upside movement on Monday but rested against the resistance level at 2,300 from where a downside correction began.

Friday’s breakdown below the 50-day SMA allowed sellers to gain power. Short positions below $2,285 will support negative moods and drag the precious metal price to the next supply level at $2,253. Moreover, in case of further negative bias, Gold is likely to reach $2,220 and $2,200 consequently.
The good news for bulls will be after the price makes a breakout and manages to reach $2,325. This barrier prevents the price from going even higher at $2,340 and $2,350. These two resistance levels are important for the moment. However, breaking them will pave the way for XAU/USD to $2,380 and even $2,400.


