EUR/USD is Trying to Restore on the Eve of the US CPI Data

EUR/USD moved above 1.0900 again last week after a downturn attempt. The currency pair is trying to break above 1.0940, which is the closest local resistance level. The asset is supported by the upcoming US inflation data, which promises to be positive for EUR/USD as the US yearly inflation is likely to stay around 3.0%, which will add to expectations of the US Fed rate cut in September.
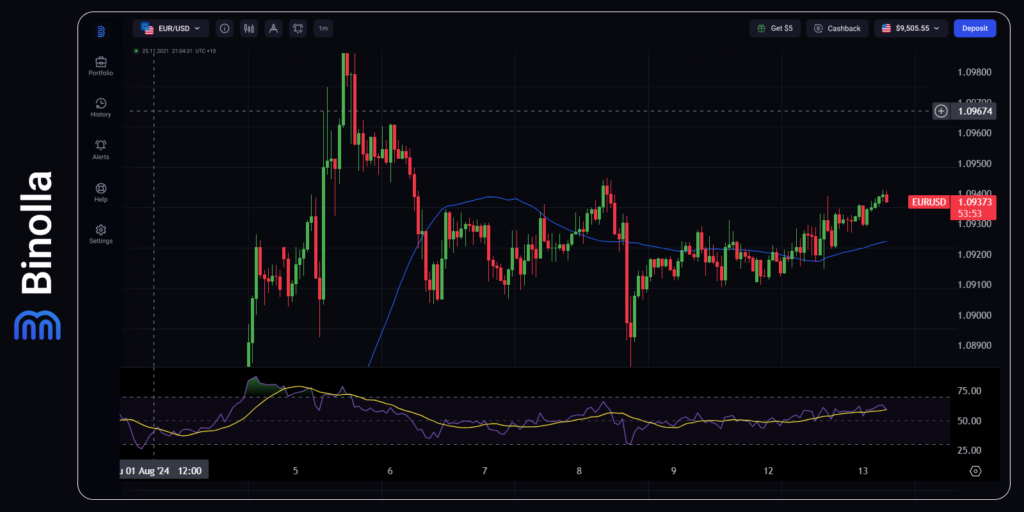
From a technical standpoint, EUR/USD has been trading in a range for a while. There was an attempt to break above 1.1000, the key psychological level, but the currency pair failed to consolidate above and plunged to 1.0900 again.
The SMA 50 is below the price currently, which gives hope to buyers that EUR/USD is likely to resume its uptrend, especially on the eve of the US yearly CPI data, which is likely to support the idea of the Fed cutting rates in September.
The RSI indicator moves slightly higher, but it is still below 70, which is another positive signal for the currency pair as it is still not overbought.
Contents
- 1 GBP/USD Is Slightly Rising: Traders Are Waiting for the UK and US Key Data Releases
- 2 Market Volatility? Profit from It!
- 3 NZD/USD Is Striving for New Peaks Ahead of the RBNZ Meeting
- 4 USD/JPY Aims Higher Despite the Fed Monetary Policy Changes Expectations
- 5 Bitcoin Struggles to Restore Above $60,000
- 6 XAU/USD Moves Higher as General Concerns Still Prevail
GBP/USD Is Slightly Rising: Traders Are Waiting for the UK and US Key Data Releases
The UK inflation data along with GDP monthly dynamics will have a serious impact on GBP this week. According to the latest forecasts, the UK yearly inflation is expected to accelerate to 2.3% from 2.0% previously. When it comes to monthly economic growth in the United Kingdom, economists expect it to plunge from 0.4% to 0.1%.
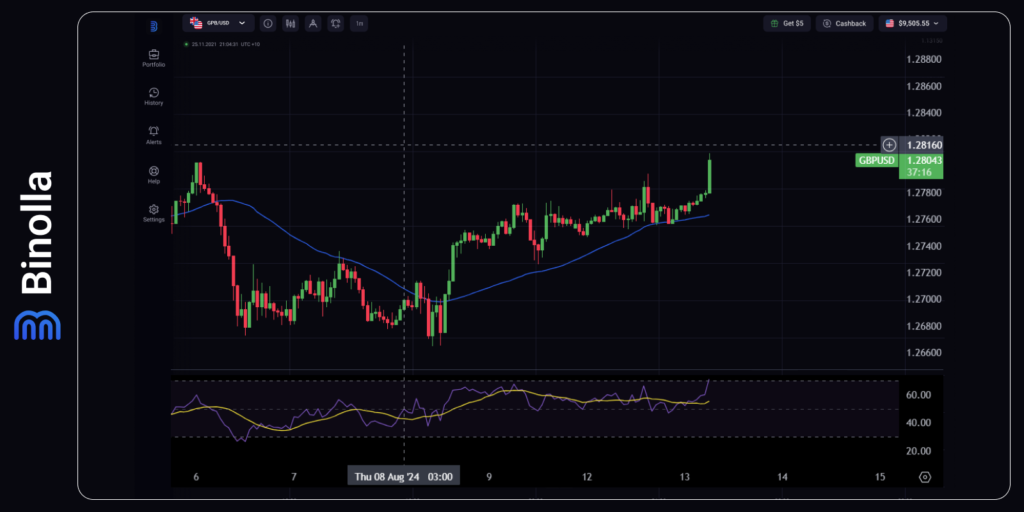
The hourly GBP/USD chart shows signs of the upcoming uptrend as the price is above the SMA 50. After a bearish attempt last week when the price plunged to local lows and tested 1.2680 again, the uptrend began as GBP/USD formed higher lows. However, there is a divergence between the moving average of the RSI indicator and the price, which may be a sign of a deeper correction. The RSI purple line has tested 70 and if it manages to break above, an overbought situation may occur, which will bring the currency pair a bit lower.
The currency resistance level is 1.2800, which is a round psychological area. If GBP/USD manages to get higher, two minor resistance levels at 1.2830 and 1.2860 will get in the way of moving higher. On the downside, 1.2755 prevents the currency pair from getting lower to 1.2720.
NZD/USD Is Striving for New Peaks Ahead of the RBNZ Meeting
While nothing extraordinary is expected from the RBNZ meeting on Wednesday, NZD/USD is trying to get higher as the officials are likely to leave the rates unchanged. It is worth mentioning that the press conference will conclude the event and two speeches of the RBNZ gov Orr will take place throughout Wednesday.
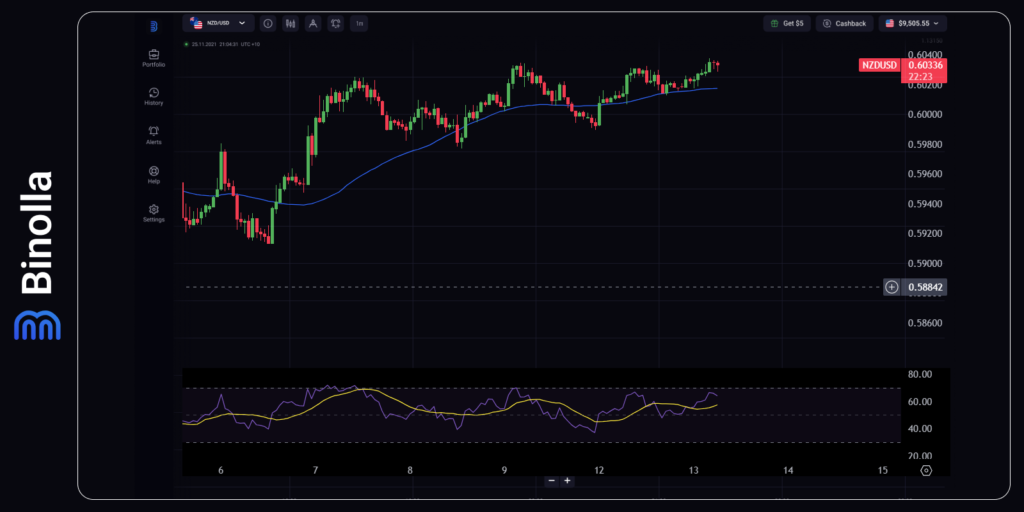
On the technical side, NZD/USD is testing 0.6030, which is a local resistance level. The SMA 50 stays below the price, which confirms the uptrend, while the RSI indicator is below 70. The closest support level is at the SMA 50, from where buyers will be able to add to their current positions to join the next part of the uptrend. The next support is at 0.5990, which is close to 0.6000, a psychological level.
If there are no surprises during tomorrow’s meeting and the RBNZ gov comments remain hawkish or at least neutral, the currency pair is likely to make another leg of the uptrend above 0.6050.
USD/JPY Aims Higher Despite the Fed Monetary Policy Changes Expectations
The Bank of Japan has switched to monetary policy normalization and raised rates two times this year. We expect the BoJ to make at least one more hike in the following months. On the other hand, the Fed is likely to make at least one dovish step in September and we expect the Federal Reserve to cut rates again in November-December 2024.
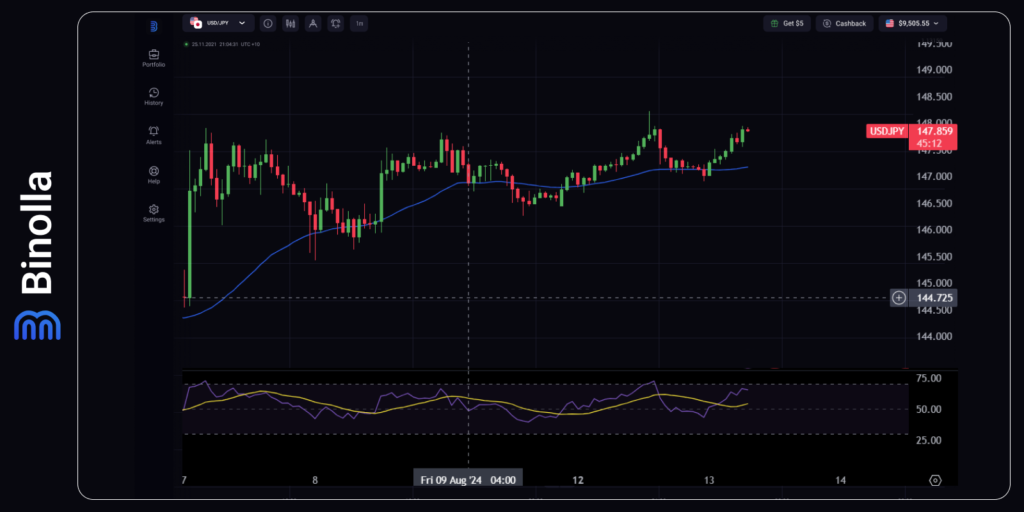
From the technical perspective, the currency pair moves above the SMA 50, which acts as a dynamic trendline and can be used by traders to find entry points for their swing strategies. When it comes to RSI, the line is still below 70, which leaves some space for buyers to hold to their current positions and to add new ones.
USD/JPY is testing 148.00, the resistance level that prevents the price from going higher from August 7, 2024. If the currency pair manages to break it, the next resistance will be at 148.70. On the downside, the closest local support lies at 147.15
Bitcoin Struggles to Restore Above $60,000
Unlike many risky assets that have taken the opportunity and went upwards on the expectations of the Fed cutting rates in September, Bitcoin’s growth is problematic as the cryptocurrency failed to jump over $60,000.
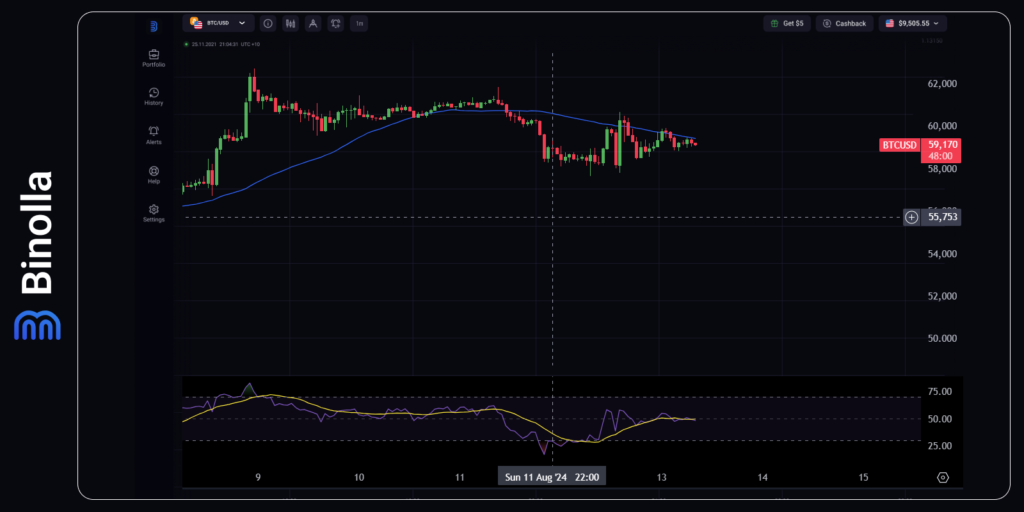
The currency pair stays below the SMA 50, which may be one of the signals of the downtrend developing. BTC/USD managed to test $60,000 at the beginning of the new week but moved backward below this level, which was broken during Black Monday last week.
Is the cryptocurrency able to switch to the uptrend? Unlike most assets, cryptocurrencies like Bitcoin are still considered more risky, which means that they may struggle to recover for longer. Even if risk appetites are back, investors still avoid BTC/USD and other cryptocurrencies and prefer to focus on indices and stocks.
If BTC/USD breaks above $60,000, another round of a local uptrend may begin with mid-term goals at $67,000-$68,000. By staying below this level, the risks of a downside movement become higher.
XAU/USD Moves Higher as General Concerns Still Prevail
Gold shows positive dynamics this week as concerns about the US and global economy still prevail. While it is almost evident that the Fed is going to cut rates in September, some economists still think that the FOMC is late with the launch of a new round of expansionary policy.
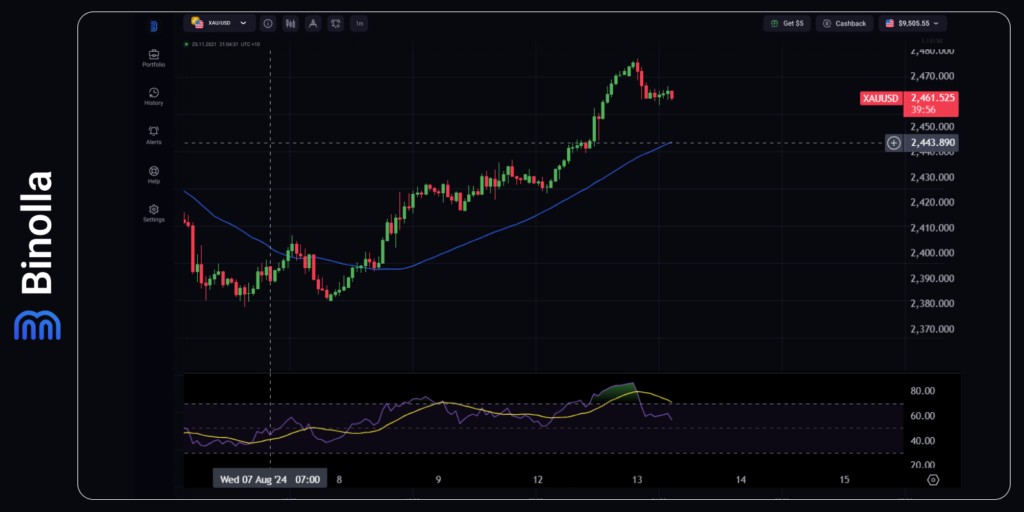
Gold stays above the SMA 50, which is a clear sign of the uptrend. XAU/USD reached local highs at 2,475 on Monday but failed to move higher. This correction was clearly seen with the RSI indicator, which fast line moved above 70 and then moved back below it. EUR/USD and other majors restored against the US dollar as the expectations of the Fed cutting the rate in September are rising. Unlock the perspectives of the currencies during the upcoming week. Discover the full technical picture of the most traded assets.
On the upside, by breaking 2,475, XAU/USD is likely to move towards its next high at 2,500, which is a round psychological level. The closes support level is at 2,460.


