Envelopes Indicator: Trade with Dynamic Price Channel

Technical indicators are very useful in trading as they allow market participants to create various strategies. Most technical analysis tools of this type can be used autonomously, which means they can be trading strategies themselves. Envelopes are among them.
While there are several trading tactics that may include Envelopes as an auxiliary indicator, there are also several tactics that allow you to leave the indicator alone on the chart and find entry points for whatever financial instrument you buy or sell. If you want to learn more about Envelopes, their purpose, and, what is even more important, their application for various strategies, then read this article until the final stop. Register at Binolla now and start your way to financial independence.
Contents
What is Envelopes Indicator?
The indicator’s main purpose is to provide traders with information about the upper and lower boundaries of the current market range. Even if the price is trending, there are price ranges most of the time, except in those situations when you have a very strong rocketing momentum.
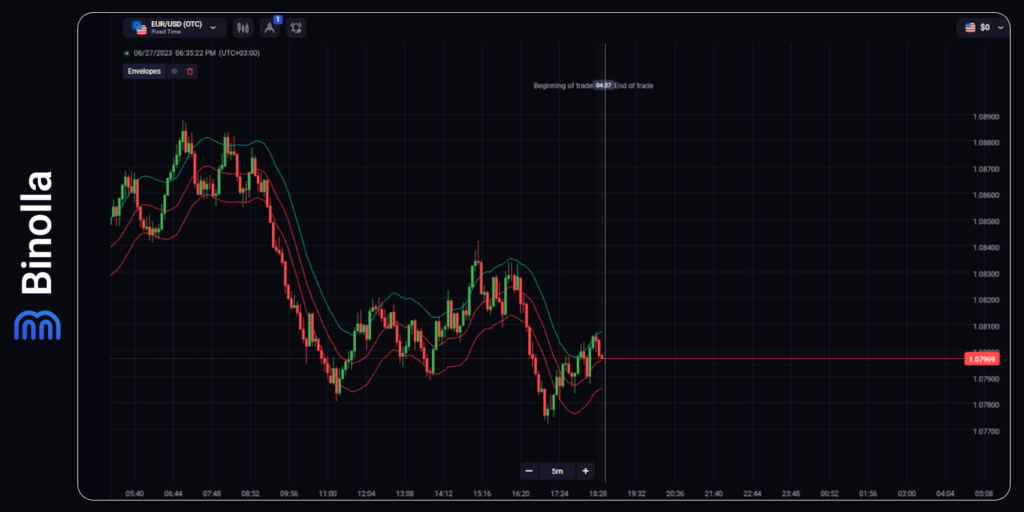
As it comes from its name, the indicator “envelopes” the price from both sides. In its classic version, Envelopes has only two lines on both sides of the range, but Binolla offers a modified indicator with a moving average between both boundaries. This allows you not only to see the price range but also to watch the central moving average, which is an indicator of the average price for a particular period.
Envelopes Formula
The basic principle of Envelopes is to calculate the price range by deviating it from the moving average. Here is the formula that makes the indicator create both lines that envelop the price:
- Upper band = MA (Price CloseN) x (1+ K/1,000);
- Lower band = MA (Price CloseN) x (1-K/1,000).
Where:
- MA is a moving average of any type;
- Price Close is the closing price for a particular time interval;
- N is a period;
- K/1,000 is a deviation from the average price of the asset.
Envelopes Settings
Before you can start using the indicator to its fullest, it is a good idea to learn more about its parameters and controls. While in most cases, you don’t need them, in some strategies, it may be useful to choose settings on your own.
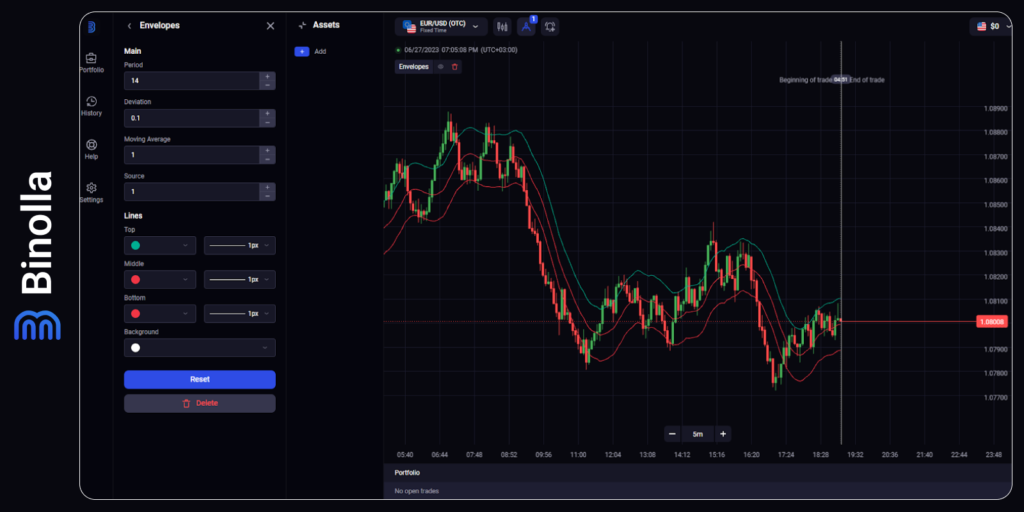
Let’s take a look at all the options that you have here, one by one:
- Period. This is the number of candlesticks that are taken into account when you trade with Envelopes;
- Deviation. Another key parameter that allows you to set the distance between the boundaries of the indicator. By setting it higher, you will see the distance between them increasing. On the other hand, if you need the range to be tighter, you should decrease the deviation parameter;
- Moving Average. This parameter allows you to choose which type of moving average you are going to choose in the indicator calculations.
There are also some secondary parameters that allow you to set the color of all three lines as well as define their thickness.
How to Use Envelopes
After applying the indicator to the chart, you will see that it envelops the price. Therefore, the first idea that may come is to use it to watch the boundaries of the current price fluctuations. By using Envelopes, you don’t need to build a trading channel on your own. The indicator will do it for you.
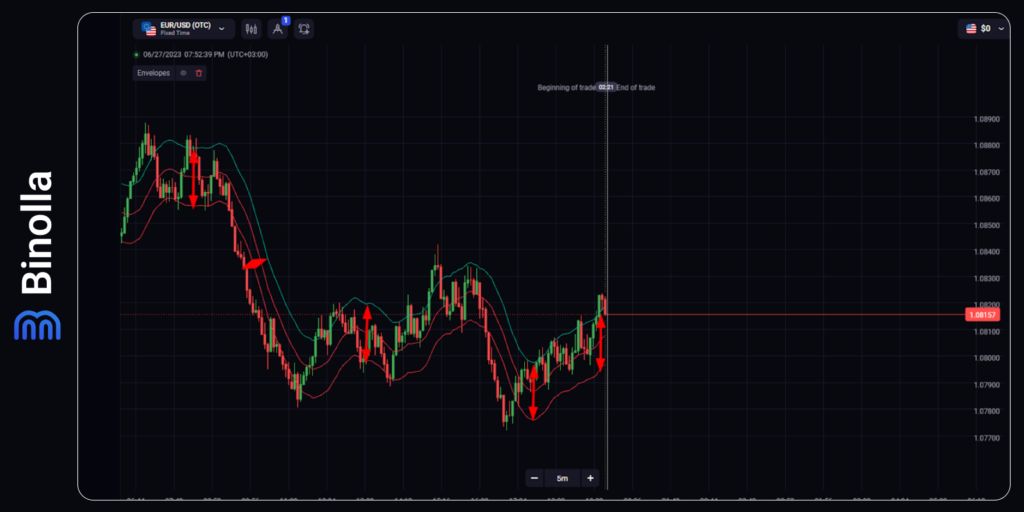
The distance between both sidelines is constantly changing, and you can see it when you apply Envelopes to your charts. Knowing this distance will provide you with useful information about the current volatility. If the distance between the two lines is wide enough, the volatility is high, while tight Envelopes indicate small volatility.
The central line of the indicator is the moving average. We have added it to our basic Envelopes indicator at Binolla for a reason. It allows you to understand the current trend and, therefore, make more reasonable trading decisions.
In this way, Envelopes are similar to Bollinger Bands, which is true as both indicators have the same calculations behind them.
Envelopes can be used this way for both discovering the current trend and volatility. Therefore, you can apply it to find entry points or add this indicator to some strategies to augment them.
How to Trade Using the Indicator
There are two main ways for traders to use the indicator. Both allow you to find entry points. Here is how you can apply Envelopes and augment your strategies.
Channel Trading
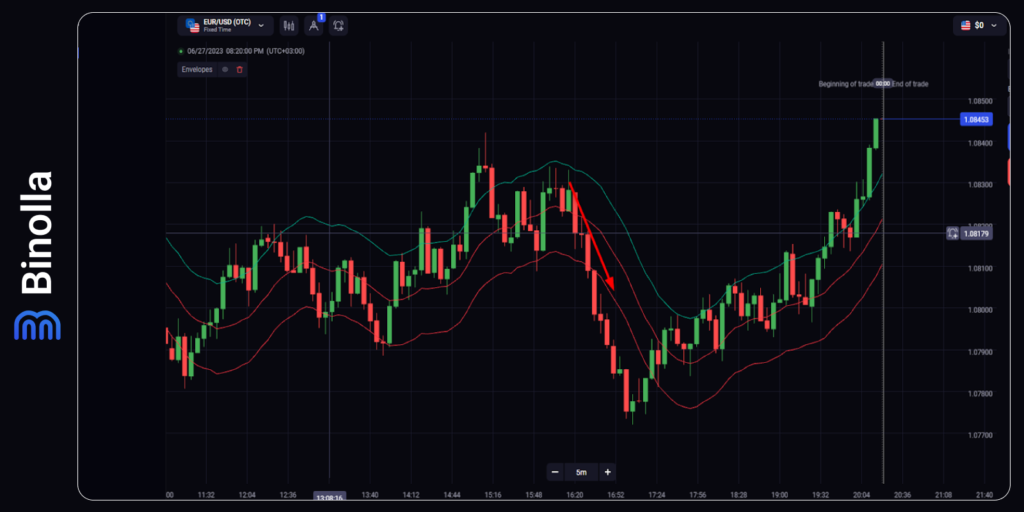
The first way to trade with Envelopes is to find entry points inside the channel. In the example above, you can see the price reaching the upper boundary. Here, you can wait for a reversal signal to appear to trade.
In our case, we have the Shooting Star pattern, which is another confirmation for the price to reverse and go down after a while. Therefore, once this signal appears, traders can buy Lower contracts.
When it comes to Forex CFD trading, you can sell a currency pair or any other asset that you are trading. As for a stop loss order, you can place it above the upper band, while a take profit order can be placed somewhere close to the lower band.
One of the drawbacks of this methodology is that you can’t be sure whether the price is going to reverse or continue moving higher. Most beginner traders are trapped at this point and lose money. Therefore, it is better to augment this approach with some additional tools.
We recommend using the Japanese candlestick price action system. This will allow you to find signal confluence and be more sure about a particular entry point.
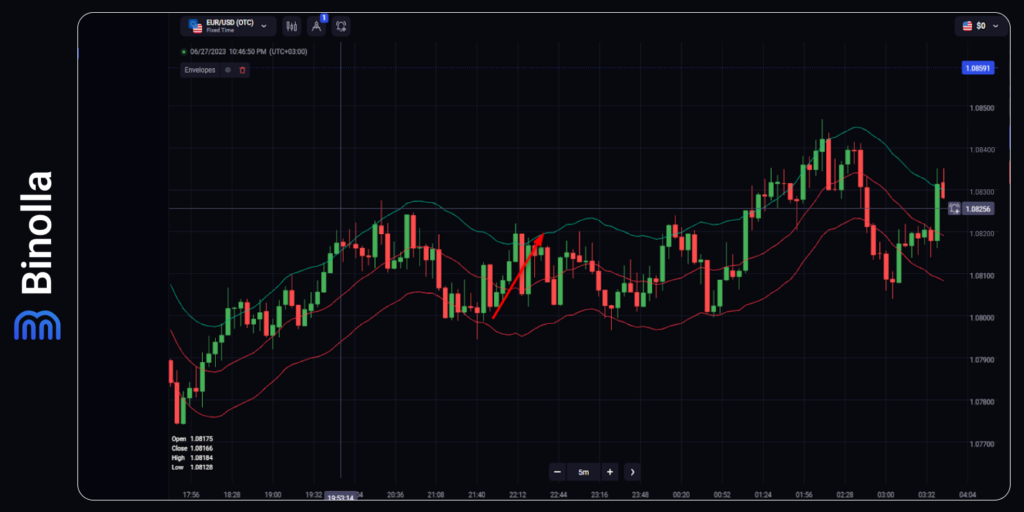
Let’s have a look at the image above. The price tests the lower band of the Envelopes indicator. Another signal comes from the price action system, as we have a clear bullish Hammer pattern. Therefore, instead of one, we have two confirmations of the probable market reverse, which allows us to buy a Higher contract or a currency pair if we are trading Forex CFD instruments.
Breakouts
Another very popular strategy that you can use when trading solely with Envelopes is to use breakouts. Sometimes the price goes beyond the indicator’s borders, offering several great opportunities for trading.
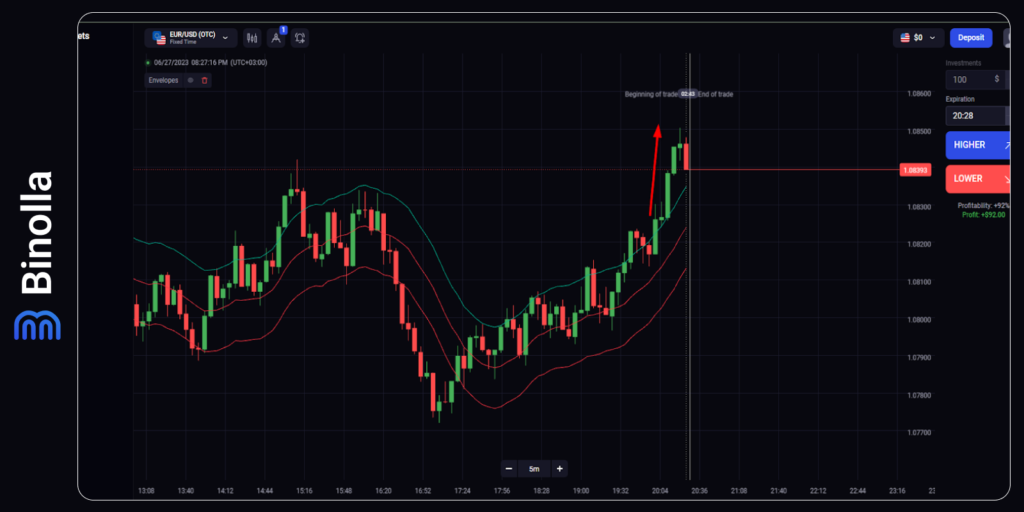
Another example demonstrates how to trade breakouts when using Envelopes. Once the price goes beyond the upper border of the indicator, you can buy a Higher contract or purchase a currency pair if you are trading Forex CFD. This is as simple as it sounds. However, you should beware of false breakouts. Therefore, this approach is great only if you are trading on some big news or serious price momentum.
Price Filter
There are only two ways to get entry points when you trade with Envelopes, but this is not the only way to use the indicator. You can add it to various trading systems to augment them and make them even more profitable.
Envelopes can be used as a price filter. The changes in the indicator’s slope can be really helpful when you are trying to determine whether the market has any price movement direction or simply goes sideways.
Advantages of the Indicator
Envelopes have a lot of advantages that allow you to use them in most situations. Here are all the benefits that you can enjoy when applying the indicator to a chart:
- Envelopes can be used to trade any type of underlying asset. Whatever currency pair, stock, commodity, precious metal, or cryptocurrency you choose, you can always use Envelopes to see the price range, define the current trend or find reversal or breakout entry signals;
- The indicator can be equally applied to digital options and Forex CFD. Whatever financial instrument you use, you can always find entry points, as Envelopes is an autonomous indicator that allows you to build strategies even if you don’t use any other analysis tools;
- Envelopes allow you to follow the current trend. The middle line of the indicator is a moving average, which follows the price, showing you the current market price movement direction;
- The indicator allows you to trade within the channel. You don’t need to build a price channel on your own, as the indicator draws it for you. Moreover, when the time passes, you don’t need to adjust anything as the channel by Envelopes is dynamic and changes automatically after new market updates;
- Envelopes are very simple and straightforward. While the formula of the indicator may seem very complex and confusing, you don’t need it in your daily trading routine. The only thing that you need is to know how to use this technical analysis tool to turn any market situation in your favor.
Disadvantages of Envelopes
While the indicator has plenty of strong points, some disadvantages also exist:
- The first drawback of Envelopes is that the deviation works for one timeframe only. For instance, if you choose the 0.1 deviation for a 5m chart and then switch to the higher timeframe, the deviation remains the same, but the distance between the lines becomes smaller. Therefore, you will have to apply new deviations settings for each particular timeframe, which may not be comfortable, especially when you are in a hurry and conducting multi-timeframe price analysis;
- Another disadvantage of using Envelopes is that they create many false signals when the price is sideways. However, the positive thing here is that while you can’t catch huge trends at this moment, you can use the opportunity to trend in different directions, especially when you are dealing with digital options;
- Last but not least, Envelopes is a lagging indicator like any other technical analysis tool that is based on the moving average. Therefore, you are going to receive information that is a bit outdated. However, this drawback can be compensated if you use Japanese candlesticks, for instance.
Final Words
The Envelopes indicator is a standard technical analysis tool that is presented in a better way on the Binolla platform, as along with “enveloping” lines, it has the middle moving average, which shows you the current price movement direction.
The technical indicator allows traders to find entry points both inside the channel and when it leaves one of the boundaries during strong momentum movements. While Envelopes is a self-sufficient technical analysis tool, it is recommended to add some other tools or systems, like price action, to make it even more efficient.
FAQ

What is the Envelope Indicator?
This is a trend indicator that builds lower and upper bands to envelop the price and help traders find the current price channel. It can be used in various strategies as a standalone tool or to augment trading tactics as an auxiliary technical analysis tool.
How Do You Use Envelopes?
The Envelopes indicator is good for finding entry points within the price channel when you buy Lower options once the price rejects the upper band and buy Higher contracts after the price rejects the lower band. Moreover, the indicator can be equally used during price breakouts when you can buy contracts in the direction of the price momentum.
What Type of MA is Used in the Envelopes Indicator?
All types of moving averages can be used in the Envelopes indicator. It depends solely on your preferences.

