EMA vs. SMA: Which One to Choose for Successful Digital Options and CFD Trading

Technical analysis is one of the ways traders can be successful in the financial markets. Whether you buy stocks, cryptos, or FX currencies directly or indirectly through various types of contracts, by using technical analysis, you can significantly improve your chances of predicting the next price move and, thus, capitalize on it. Moving averages are among the most popular technical indicators in the history of trading. While they are also among the oldest tools, they are still relevant.
By using moving averages, traders can pinpoint current market movements on various timeframes, from major to minor, and even find entry points. Some of the most popular moving averages are simple moving averages and exponential moving averages. To help you choose between them, we have prepared the following article. By reading it, you will discover the differences as well as use cases for both and even the possibility of their combination in your trading routines.
Ready to elevate your trading game to a new level? Join Binolla, the most reputable digital options broker so far!
Contents
- 1 Moving Averages Basics
- 2 A Simple Moving Average
- 3 SMA = A1 + A2 + … n / n
- 4 An Exponential Moving Average
- 5 EMAtoday = (ValueToday * (Smoothing / 1+ Days)) + EMAYesterday * (1 – (Smoothing / 1+Days))
- 6 Key Differences between SMA and EMA
- 7 When Using SMA and EMA?
- 8 Start Using These Indicators with Binolla!
- 9 Pros and Cons: Comparing the Benefits of Using SMA vs. EMA
- 10 Common Strategies and Use Cases
- 11 Conclusion: SMA or EMA – Which One Is Better?
- 12 FAQ
Moving Averages Basics
Before delving deeper, it is worth starting with the description of the main concept of moving averages. A moving average is a technical indicator that shows the average price for a specific period. For instance, if you take a 20-period moving average of any type, the line will show you the average price for the last 20 candles.
The moving average helps traders identify the price movement direction by eliminating the market noise. This is the first and main idea of applying this indicator.
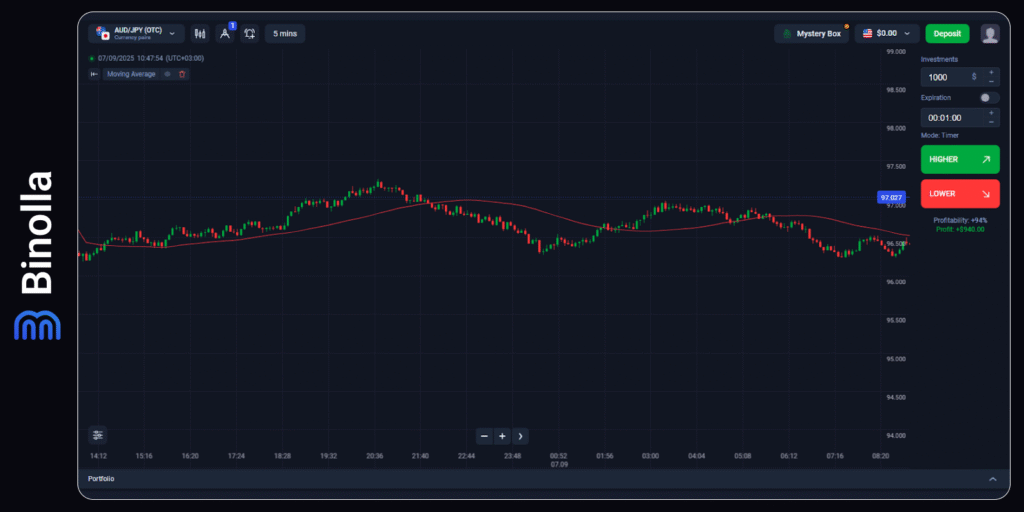
As you can see it on the chart, the SMA50 demonstrates trend direction in a clear and simplistic way. If the line goes upwards, the bullish trend is developing, while when the line changes its slope to downward, then the downtrend is developing.
Before going further, one more thing should be considered. Moving averages are lagging indicators. This means that the line is building after the price and not in advance. This creates some inconveniences, but in general, if you clearly understand the concept and use moving averages in the right way, they may be very helpful
A Simple Moving Average
Now, let’s move further with a simple moving average. As it comes from its name, this is a standard moving average that is calculated as the average price for a specific period. It smooths price fluctuations, giving you a clear picture of past and current price movements.
The SMA formula is the following:
SMA = A1 + A2 + … n / n
Where:
A – each of the data points
n – number of periods
The key features of the simple moving average, or SMA, include:
- Equal weighting. Every point of the moving average has the same important as any other point of the indicator.
- Smoothness and stability. A simple moving average is stable with equal weighting.
- It provides a better picture of bigger trends.
Traders apply the SMA in various situations. For instance, using this indicator, they can outline major suppor and resistance levels, find entry points with Golden and Death Cross strategies, or simply filter the market noise.
When using the SMA, you should be aware of its slower reaction time, which can be a disadvantage, especially when you trade digital options or use fast-paced scalping or intraday strategies in CFD trading.
An Exponential Moving Average
Unlike the simple moving average, which is a classic line, the exponential one gives more weight to recent prices. It still smooths price data, but the reaction to the current market action is faster. The formula of EMA is the following:
EMAtoday = (ValueToday * (Smoothing / 1+ Days)) + EMAYesterday * (1 – (Smoothing / 1+Days))
It works the following way: The SMA treats all candles equally inside the chosen period, while the EMA applies a weighting multiplier, which gives more importance to the most recent prices. This feature, in turn, makes the EMA very popular among short-term traders. When it comes to the key aspects of the indicator, they include:
- Faster reaction to the recent price changes.
- More sensitivity to the price changes, which provides quicker entry and exit opportunities.
- The indicator is favored by active traders.
To make a brief conclusion, the indicator allows you to catch price changes at the earlier stages as compared to the SMA, but you should be prepared for fakeouts. Thus, more conservative traders prefer the SMA.
Key Differences between SMA and EMA
Now that you know the basics and the features of both, it is worth comparing them. At first glance, both look pretty much alike, with smooth lines tracking price fluctuations. However, their inner workings make them a bit different, and this difference may give you some advantage in trading when you understand in which situation to apply each of these moving averages.
| Feature | Simple Moving Average (SMA) | Exponential Moving Average (EMA) |
| Calculation Method | Equal weight to all data points in the period | Heavier weight to recent data points |
| Responsiveness | Slower, lags price changes | Faster, reacts quickly to recent price moves |
| Signal Timing | Later signals, confirms trends | Earlier signals, catches momentum early |
| Noise Sensitivity | Less sensitive, smoother | More sensitive, prone to false signals in choppy markets |
| Best Use Case | Long-term trend analysis, major support/resistance | Short-term trades, momentum, quick entries/exits |
| Common Periods | 50, 100, 200 | 8, 13, 21, 50 |
| Psychological Impact | Provides stability and confidence for conservative traders | Appeals to aggressive traders comfortable with noise |
| Performance in Ranging Markets | Better, fewer whipsaws | Poor, many false breakouts |
| Performance in Trending Markets | Good for confirming trend | Excellent for capturing early trend shifts |
| Use in Popular Strategies | Golden Cross / Death Cross (50/200 SMA) | EMA crossovers (e.g., 9/21 EMA) |
| Complexity | Simple to understand and calculate | Slightly more complex due to weighting factor |
| Lag Time | Higher lag | Lower lag |
| Suitability for Intraday Trading | Less suitable | Highly suitable |
| Combining with Other Indicators | Often combined with trend or momentum indicators | Frequently used with oscillators and volume |
When Using SMA and EMA?
The difference between the two lines is clear and evident now. However, when to apply each indicator in real-life trading? The answer to this question will be given in the following lines. First that you should understand that before selecting either of the two, you should think about your trading style as well as check the current market conditions.
If you need to identify the market trend, you can use the SMA to get a big picture. This line will outline major trends without emphasizing the recent price fluctuations. For instance, if you apply the SMA50, you will have a clear picture of the medium-term trend on the chart.
Traders can also apply the EMA for trend identification, but this one will show you the short-term price movement direction. Market participants often use the EMA20 to be able to see how the price will react to the recent price fluctuations.
When it comes to entries and exits, the exponential moving average can be used in fast-moving markets. The line is ideal to find various market opportunities for short-term traders (scalping and intraday). On the other hand, when using the SMA, you can receive confirmation of your trading ideas, which is a great option to trade in a more secure and guaranteed way.
However, you should keep in mind that both lines can be perfectly adjusted for trading in trend conditions. When it comes to sideways markets, neither of these lines is perfect. However, when it comes to SMA, it offers a slightly better performance as it allows you to filter out some of the noise and avoid false breakouts.
Pros and Cons: Comparing the Benefits of Using SMA vs. EMA
While moving averages of both types can be very useful, they both have their own advantages and disadvantages. Knowing them may also be very helpful to traders before they make a choice or even decide to combine them both in their strategies.
Simple Moving Average
| Positives | Negatives |
| The SMA provides stability and smoothness, which is great for filtering out market noise and focusing on longer-term price fluctuations | Slower reaction to the latest price changes does not allow this line to be used as a reliable indicator for entry and exit points |
| By using the simple moving average, the traders can receive reliable confirmation of breakouts and recent trends to be sure about entry and exit points | Traders who use SMS may use early momentum |
| SMAs are widely used by traders and they sometimes act as self-fulfilling support and resistance levels | The simple moving average is less useful on smaller timeframes |
Exponential Moving Average
| Positives | Negatives |
| EMA is effective for faster reaction to the recent price changes, which makes it a great tool for those who want to catch new trends earlier | EMA is more sensitive to market noise, which makes it a less reliable as it offers more false signals |
| The indicator can be used by traders who apply momentum-based breakout strategies | EMA often leads to overtrading |
| In general, the indicator is better used for fast-paced trading methods | The indicator is less reliable as major support and resistance levels |
Common Strategies and Use Cases
Traders often use various moving averages in their trading strategies. This chapter contains some of the most popular and time-tested methods for both types of indicators.
Golden and Death Crosses (SMA)
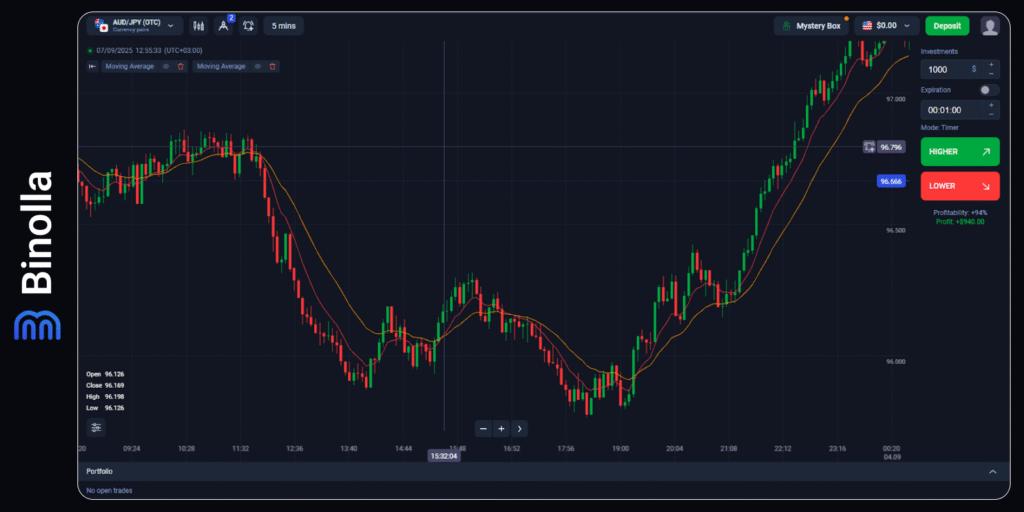
One of the most popular strategies with SMA is using the two lines with periods of 50 and 200. The idea is simple. You need to wait until both lines cross each other. If the faster SMA crosses the slower one from below, the buy signal occurs. Should the faster SMA cross the slower one from above, a sell signal occurs.
When to buy with this strategy? The moment of a crossover itself does not provide a clear signal. Therefore, you can look at the price momentum. If the price breaks a local resistance level, it confirms the buy signal.
On the other hand, during the death cross situation, you can sell when the crossover occurs and at the moment when the price breaks below the local support level. The strategy can’t be used by digital option traders as its signal is vague, and the initial momentum ends by the moment when any of these crosses appear.
EMA Crossover Stratregy
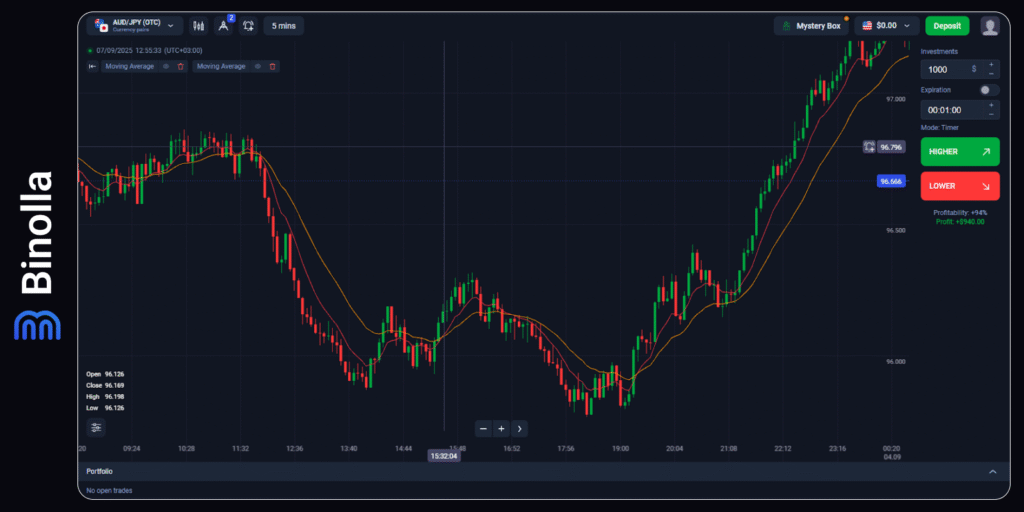
Similar to the SMA crossover, traders can apply two exponential moving averages to find entry points. However, this time you should use periods or 9 and 21. The buy signal comes when the faster EMA crosses the slower from below, and the sell signal appears when the faster EMA crosses the slower from below.
This strategy can be used by both digital options and CFD traders as it catches faster price movements. However, in both cases, you should be aware of possible fakeouts. It is better to open positions when the price crosses both moving averages, as a momentum occurs at this moment. Thus, to buy a Higher contract, you should wait for the price to make an upside breakout, while to buy a Lower contract, wait for the price to make a downside breakout of the two lines.
Dynamic Support and Resistance Levels
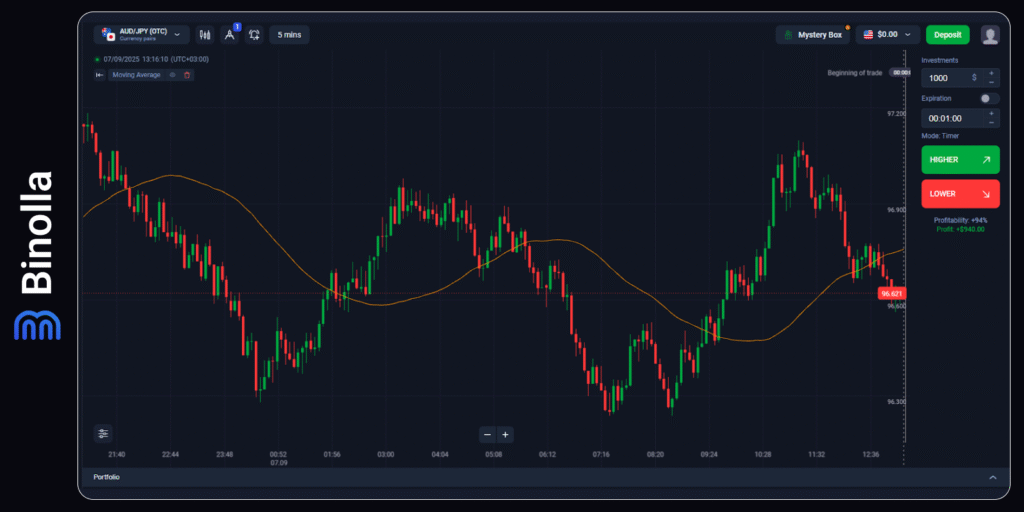
This one is not a strategy itself, but an opportunity for a trader to filter out when bulls or bears control the market. When the price is above the SMA50, this means that bulls are controlling the market. Therefore, you can use any buy strategy to enter the market, like swing trading, breakout strategies, etc. The SMA50 plays a role as the support level in this case, and you can place a stop loss below it.
On the other hand, you can find short entries when the price is below the SMA50, as the dynamic line will act as a resistance level in this case. Once you are in the market, you can place stop losses above the line.
Conclusion: SMA or EMA – Which One Is Better?
Both moving averages can add some more sense to your strategy if you know the exact reason for applying them. For instance, if you add the SMA, you expect some stability and consistency for identifying longer-term trends or using it as a support and resistance level. EMA, in turn, provides you with information about the recent price changes, which can be useful if you are looking for shorter-term entries. Anyway, moving averages are strong indicators that can significantly improve your trading results. By knowing their strengths and weaknesses, you will definitely increase your trading performance.
FAQ

Which moving average, EMA or SMA, is better for beginners?
Beginners often start their trading with the simple moving average, thinking that it is easier to use as it is smoother and less sensitive to price noise. However, even if you choose this path, you can also try EMA and then find out which one will suit your trading style.
Can I combine both moving averages in trading?
Yes, sure. These moving averages do not contradict each other, meaning that you can find use cases when both will be applicable.
Which moving average is better for day trading?
The exponential moving average is better for day trading. This is due to the fact that it gives more importance to the recent price instead of spreading the weight across the whole period.
Can I rely solely on moving averages?
Yes, in some strategies like crossovers, you can use moving averages alone. However, you can also create your own strategies by combining moving averages with other indicators/technical analysis tools.


