Donchian Channel: A Beginner’s Guide to the Trend-Following Indicator

There are a lot of technical indicators nowadays that are designed to highlight the current market trend and define the volatility level. The Donchian Channel indicator is not among the most popular ones, but it is a reliable tool that meets all the traders’ requirements in this niche. In this article, we are going to shed light on this indicator and see how you can use it in your trading strategies. If you are ready to start trading now, open an account at Binolla.
Contents
Donchian Channel Basics
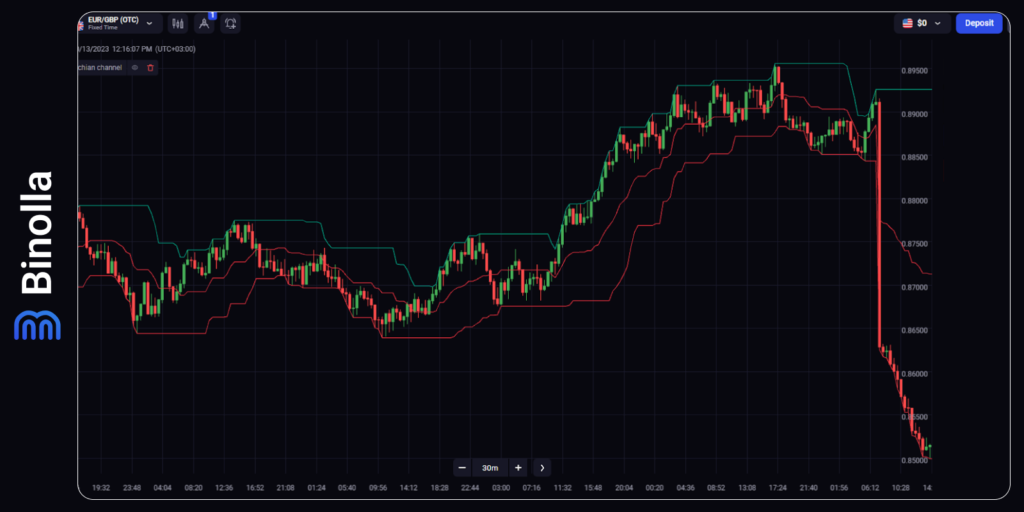
Donchian Channel are a technical indicator that can help traders identify trends, breakouts, and reversals in the market. It consists of three lines: the upper, the middle, and the lower band. The upper one is the highest high of the last N periods, the lower line is the lowest low of the last N periods, and the middle channel is the average of the upper and lower boundaries. The period N can be any time frame, such as minutes, hours, days, weeks, or months.
Donchian Channel can be used to measure the volatility of the market price. A narrow channel indicates a stable price, while a wide channel indicates a fluctuating price. They can also be used to generate trading signals based on the price crossing the channels. A long position can be established when the price breaks above the upper channel, indicating a bullish trend. A short position can be established when the price breaks below the lower channel, indicating a bearish trend. The middle channel can act as a support or resistance level, depending on the direction of the trend.
How to Add and Set Up Donchian Channel on the Binolla Platform
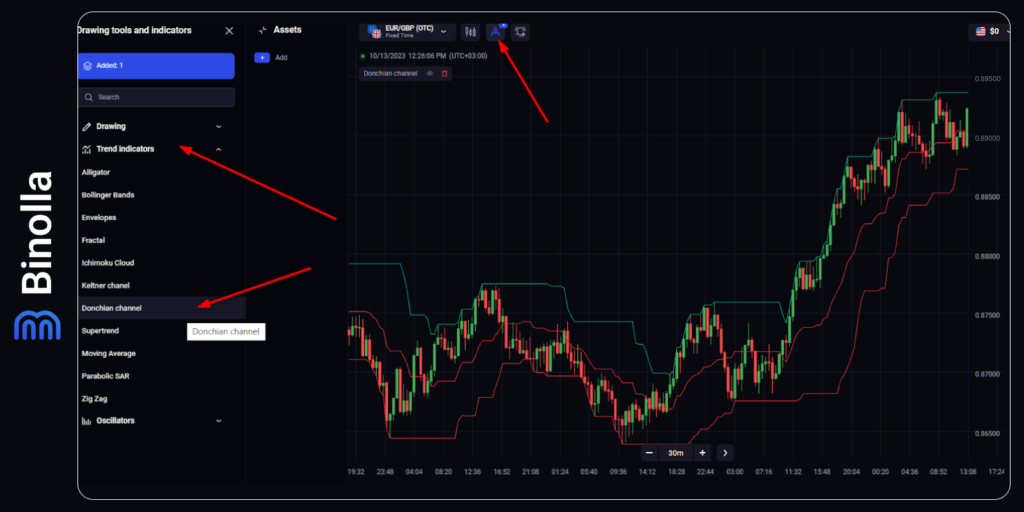
To start using the Donchian Channel indicator on the Binolla platform, you need to perform several simple steps:
- Click on the icon with tools at the top of the screen once you are in your account.
- Move the cursor to the left and click Trend Indicators in the vertical menu.
- Press on Donchian Channel in the indicators’ list that appears.
Now you have applied the Donchian indicator to your chart.
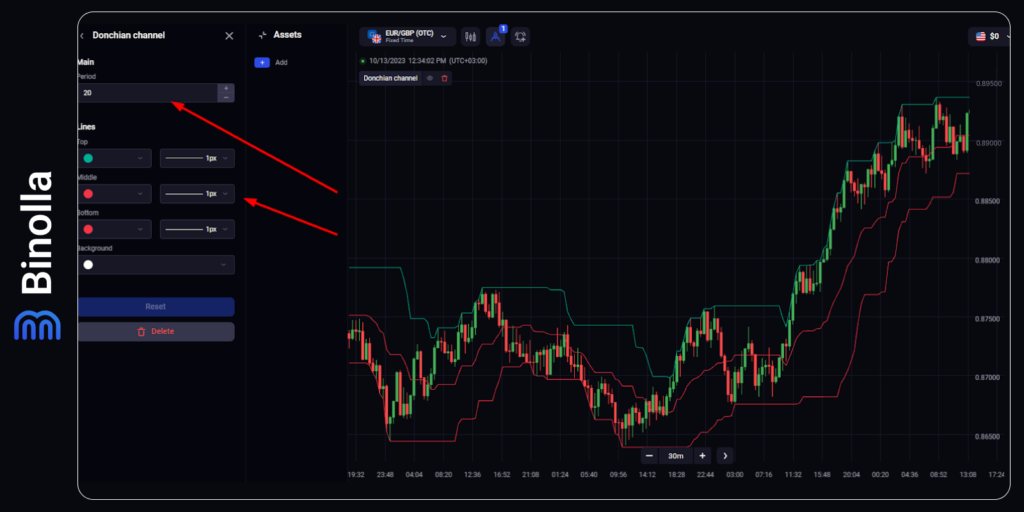
It is time to adjust the settings, if you want. Click on the indicator panel at the top of the chart and you will see several parameters. The key one is the period on the indicator. It is set to 20 by default. We recommend using it as the price stays within the boundaries of the tool and provides traders with reliable signals.
By increasing the period of the technical indicator, you will widen the distance between the extreme lines, which may lead to situations where you miss some trading signals. If you start decreasing the number of candlesticks that are calculated for the indicator, you will see the price going outside boundaries more frequently, which, in turn, may lead to the appearance of a lot of false signals.
However, in some strategies, you may need the technical tool to be more sensitive to price fluctuations. Therefore, traders change the period to a lower one. On the other hand, if you want to smooth fluctuations, you may want to increase the period of the technical analysis tool.
Donchian Channel Strategies
This technical analysis indicator may be very productive when it comes to real-life trading. There are plenty of strategies that you can apply using it solely or in combination with other technical indicators or even price action. Here are some interesting trading systems that you can adopt and start applying right away.
Donchian Channels Buy Strategy
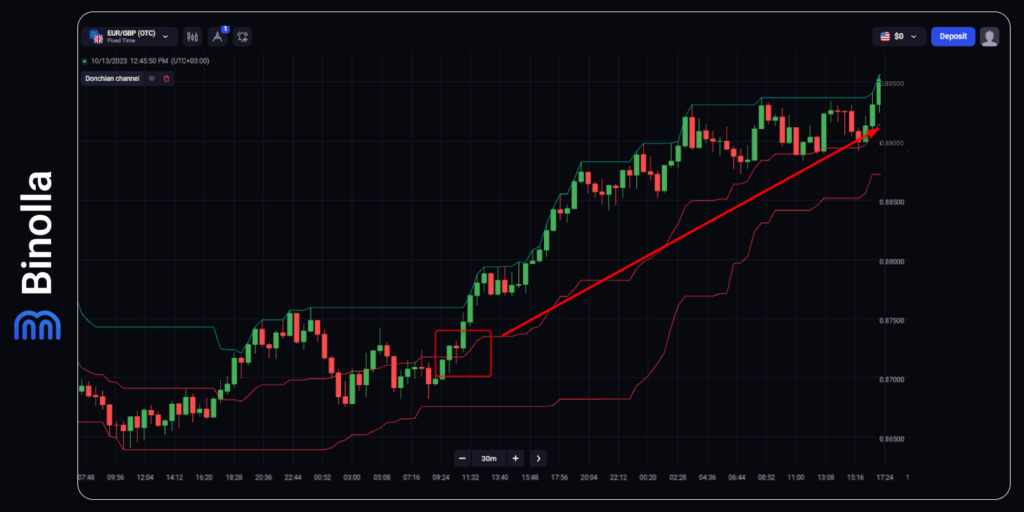
The first strategy that we would like to share with you is one in which you can buy a Higher contract or purchase a currency pair/stock on the rising market. The idea of the strategy is very simple. You should wait for the moment when the price crosses the middle line from below and open a trade.
When it comes to digital options, you don’t need to take any further actions. After you buy a Higher contract, you simply wait for the expiration to occur. However, when it comes to Forex or stock trading, you need to protect your trade and find out where to quit.
Traders can place stop-loss orders below the middle line. As for the potential profit, they can wait for the price to go below the middle line again or simply calculate take profit according to their risk/reward system.
Donchian Channels Sell Strategy
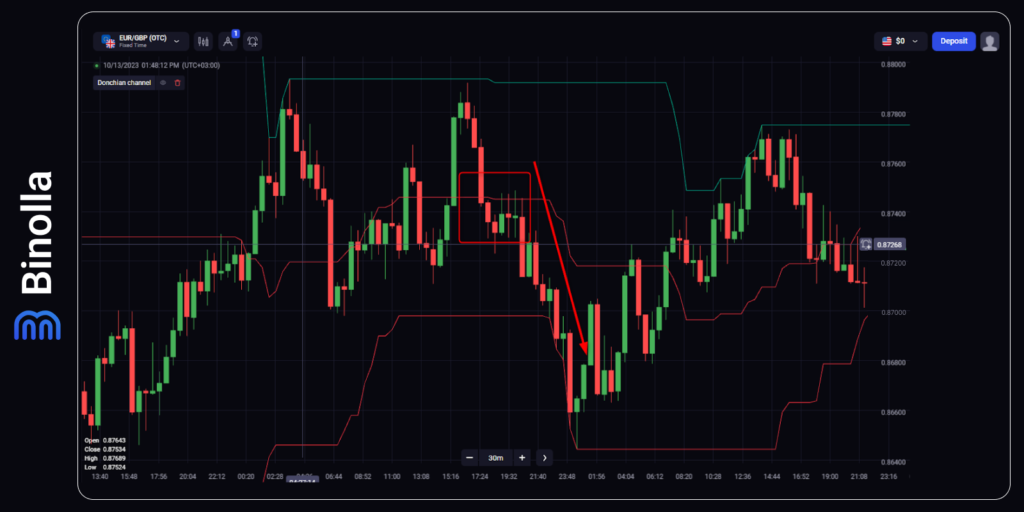
Another strategy that you can use to trade digital options or FX/stocks is when the price breaks below the middle line. When it happens, you can buy a Lower contract or sell the currency pair/stock.
Again, digital options traders can stand still and wait for the expiration to occur. FX and stock traders can undertake some steps to protect their risks and think about eventual profits. To place a stop loss, you can use the middle line. Put your protective order above it. If the price makes another breakout and goes upwards, this will mean that the downward breakout was false, and it is better to wait for other signals.
As for profits, you can hold your position until the price makes a breakout of the middle line again. You can also simply put a take-profit order at a distance that you think is appropriate according to your risk/reward ratio.
Donchian Channel vs Bollinger Bands
Donchian Channels and Bollinger Bands are two technical indicators that use three bands to measure volatility and generate trading signals. However, they have different calculations and interpretations that make them suitable for different market conditions and trading strategies.
Donchian Channels are based on the highest high and lowest low over a given period, usually 20 days. The upper band is the highest high, the lower band is the lowest low, and the middle band is the average of the two.
Donchian Channels are used to identify breakouts, trends, and reversals. A breakout occurs when the price closes above or below the upper or lower band, indicating a new high or low. A trend is confirmed when the price stays above or below the middle band, indicating a bullish or bearish bias. A reversal is possible when the price touches or crosses the middle band, indicating a loss of momentum.
Bollinger Bands are based on a simple moving average (SMA) and the standard deviation of the price over a given period, usually 20 days. The upper band is the SMA plus two standard deviations, the lower band is the SMA minus two standard deviations, and the middle band is the SMA. Bollinger Bands are used to measure volatility, overbought/oversold conditions, and mean reversion.
Volatility is indicated by the width of the bands, with wider bands implying higher volatility and narrower bands implying lower volatility. Overbought/oversold conditions are signaled when the price reaches or exceeds the upper or lower band, indicating a possible reversal or pullback. Mean reversion is based on the assumption that the price tends to return to its average value over time, so traders look for opportunities to buy near the lower band and sell near the upper band.
Both indicators can provide useful information for traders, but they have different strengths and weaknesses. Donchian Channels are more effective in trending markets, as they can capture large price movements and filter out noise. Bollinger Bands are more effective in ranging markets, as they can identify potential reversals and profit targets.
Donchian Channels are more objective and consistent, as they only depend on high and low prices. Bollinger Bands are more subjective and adaptive, as they depend on the standard deviation, which can vary depending on the data set and time frame. Donchian Channels are more suitable for breakout and trend-following strategies, as they can indicate entry and exit points based on new highs and lows. Bollinger Bands are more suitable for mean-reversion and volatility-based strategies, as they can indicate entry and exit points based on overbought/oversold levels and volatility changes.
Donchian Channel Technical Indicator Tips and Tricks
The Donchian channel is a technical indicator that can help traders identify trends, breakouts, and reversals in the market. Some of the secrets of using the Donchian channel are:
- The width of the channel indicates the volatility of the market. A narrow channel means low volatility, while a wide channel means high volatility. Traders can use this information to adjust their risk and reward expectations accordingly;
- The price crossing above or below the channel signals a potential breakout or breakdown in the market. Traders can use this as an opportunity to enter a long or short position, depending on the direction of the breakout or breakdown. A confirmation of the breakout or breakdown can be obtained by looking at other indicators, such as volume or momentum;
- The price touching or bouncing off the middle band indicates a possible reversal or continuation of the trend. Traders can use this as an opportunity to exit a position or to add to an existing position, depending on the direction of the trend. A confirmation of the reversal or continuation can be obtained by looking at other indicators, such as trend lines or moving averages.
Conclusion
Donchian Channel is another trading indicator that is based on the “envelopes” principle. This means that the price is cloaked in a range between two extreme bands. The middle line is a moving average that shows traders where the direction of the current trend and allows them to buy digital options or buy/sell FX/stocks.
FAQ

What is a Donchian channel?
A Donchian channel is a technical indicator that measures the volatility of a market by plotting the highest and lowest prices of an asset over a given period of time.
How do you use a Donchian channel?
A Donchian channel can be used to identify trends, breakouts, and reversals in a market.
What are the advantages and disadvantages of a Donchian channel?
One advantage of a Donchian channel is that it is simple and easy to use and can be applied to any market and time frame. Another advantage is that it can capture large price movements and trends and filter out noise and whipsaws. As for drawbacks, a disadvantage of a Donchian channel is that it can generate false signals in sideways or choppy markets and lag behind the current price action. Another disadvantage is that it does not account for other factors such as volume, momentum, or support and resistance levels.
How do you adjust the parameters of a Donchian channel?
A shorter period will make the channel more responsive and generate more signals, but also increase the risk of false signals. A longer period will make the channel smoother and more reliable, but also reduce the number of signals and increase the lag.

