Bollinger Bands Technical Indicator Explained: Basics and Trading Strategies

Bollinger Bands is a classic technical indicator that was brought to life by John Bollinger, a famous trader and technical analysis researcher. This tool appeared in 1983, and it has been used by many traders since.
The main idea of the indicator is to provide traders with the opportunity to evaluate price action and check market volatility, regardless of what particular asset they use. By reading this article, you will learn more about the Bollinger Bands indicator and how to apply it to trading. We will also provide you with some basic strategies. Keep reading or start trading with Binolla right now!
Contents
- 1 Bollinger Bands: Behind the Scenes
- 2 How to Apply the BB Indicator on the Binolla Platform
- 3 Bollinger Bands: Which Period to Choose
- 4 How to Interpret the Bollinger Bands Indicator
- 5 Start using Bollinger Bands in your trading sessions!
- 6 How to Trade Using the Bollinger Bands Indicator
- 7 Bollinger Bands Explained: Video Guide
- 8 Secrets of Using the BB Indicator
- 9 Pros and Cons of Using the Bollinger Bands Indicator
- 10 Conclusion
- 11 FAQ
Bollinger Bands: Behind the Scenes
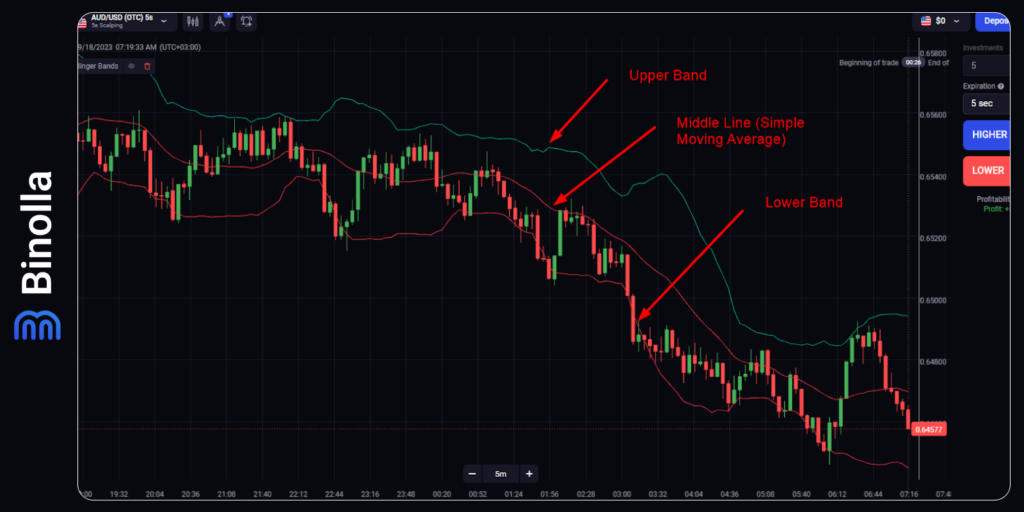
The Bollinger Bands indicator comprises a middle line, which is a moving average, and two bands that encapsulate the price, which stays within for the majority of the time. We say “the majority” as in some cases the price breaks one of the bands and stays outside for a while. However, later it returns within boundaries to fluctuate between the upper and lower bands.
Normally, traders use SMA 20 when they apply Bollinger Bands on the chart, but you can change the period if you think that this will make the indicator even more useful to you.
How to Apply the BB Indicator on the Binolla Platform
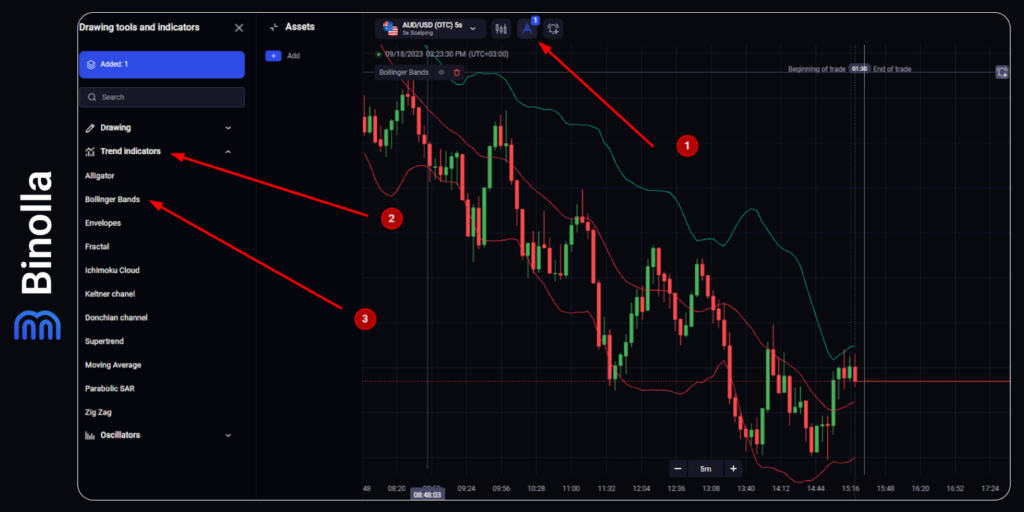
To start using the Bollinger Bands indicator on the Binolla platform, you need to perform several simple steps. Here is a detailed guide on how to apply this technical analysis tool:
- Log in to your Binolla account, go to the platform, and click on the icon with technical tools at the upper part of the screen.
- Pick Trend Indicators there.
- Click Bollinger Bands.
Once you complete all these steps, you will see the indicator added to your chart.
After you apply BB to the chart, you can also adjust some settings.
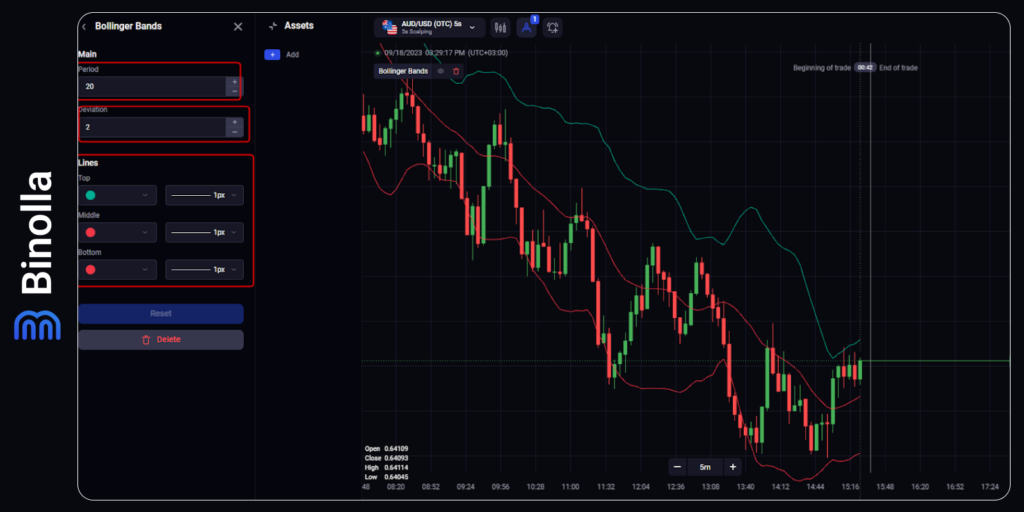
In particular, traders can change the period and deviation, as well as the color and thickness of lines on the chart.
Bollinger Bands: Which Period to Choose
The indicator uses a 20 period by default, which means that the simple moving average, means that 20 previous candlesticks are involved in calculations. There is also one parameter to consider when applying BB. It includes two standard deviations that are responsible for calculations of the lower and upper bands.
When it comes to the upper boundary, it is calculated by adding two times the standard deviation to the simple moving average. When it comes to the lower one, it is drawn by subtracting two times the standard deviation from the simple moving average.
You can use this standard SMA with a period of 20 without any hesitation. However, if you want to adjust something, you can change it. Keep in mind that the indicator is based on a moving average, which means that if you lower the period, you will see more fluctuations in the line that will be closer to price fluctuations. However, there will be more fake signals.
On the other hand, if you decide to increase the period of BB, you will face a situation when the lines are more straight. You may lose some important signals if you continue to add numbers to the indicator’s period.
The best way to start using BB is to apply it with standard settings, as they reflect all you need from the indicators on charts. Make any adjustments if, and only if, they are required by a particular strategy.
How to Interpret the Bollinger Bands Indicator
One of the advantages of this technical analysis tool is that BB is very illustrative. Once you apply it to your chart, you will have a better idea of what is going on with the price currently and even see some interesting spots where you can find great entry points.
John Bollinger invented this indicator to watch the current market volatility. You can do it as well by simply looking at the distance between the boundaries of this technical analysis tool.
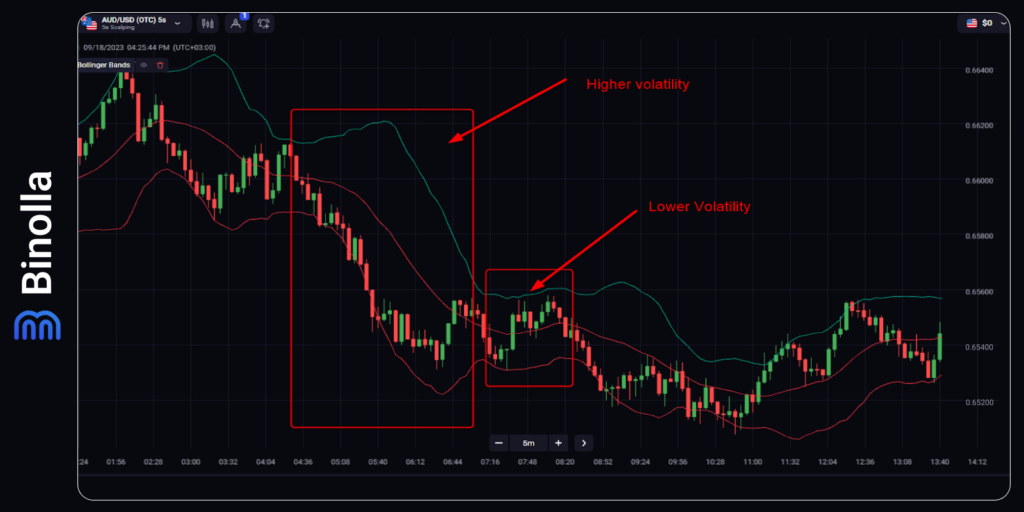
The example above shows you how to do it from scratch. After you apply the indicator to the chart, you can observe how the bands behave. If they are getting closer and making a narrow range for some time, you can say that the volatility is low in this period. However, once both bands start to move away from each other, then the volatility rises.
It is not yet a signal to trade, but it can be a kind of alert for traders to keep an eye on a stock or a currency pair and look for entry points.
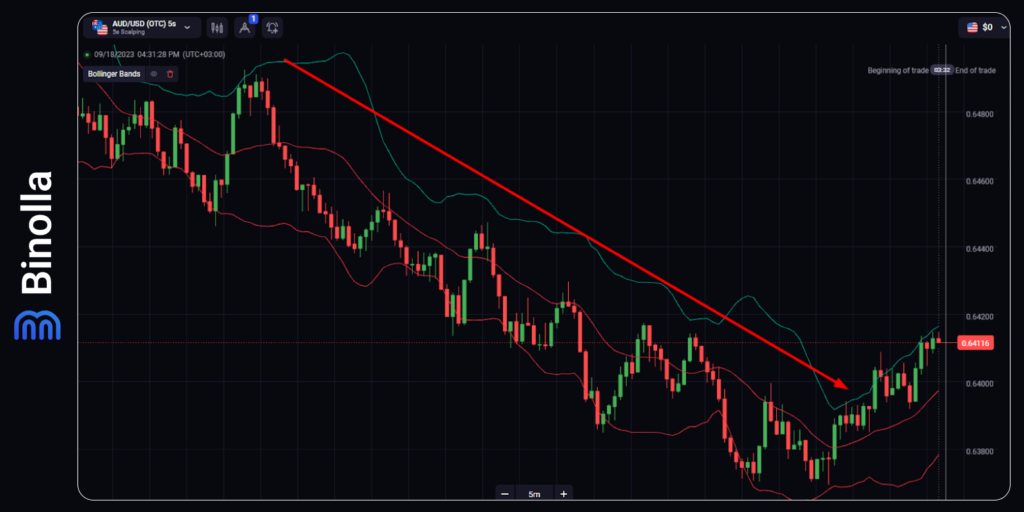
Another way to interpret what you see on charts when applying the BB indicator is to watch for trends. While the first goal of this technical analysis tool is to provide you with information about volatility, it can also be useful if you have already opened a position and need to know where to close it.
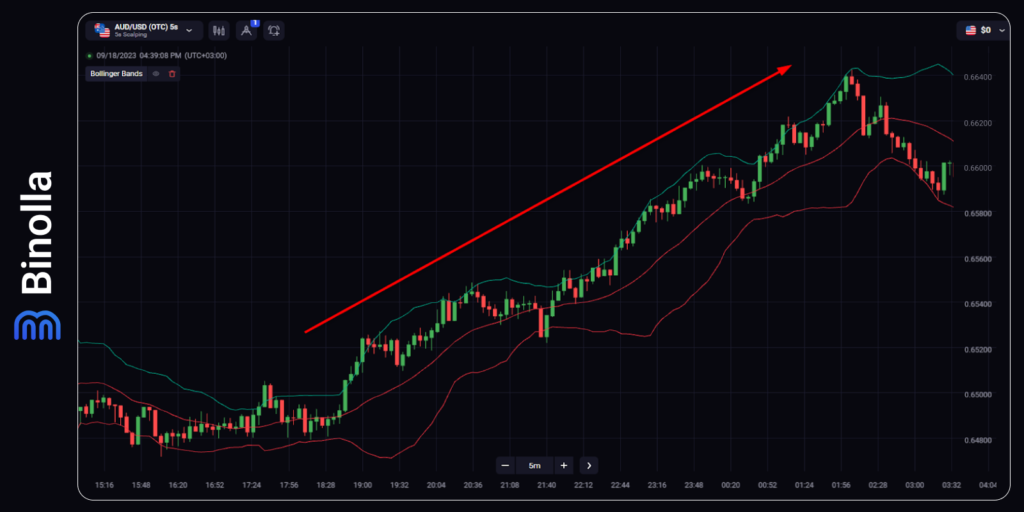
The same can be applied to uptrends. In the example above, you can see that the price is stuck to the upper band of the indicator for a while. If you hold your FX position or buy a stock for quite a long period, you can watch the indicator and stay in the market until the price goes to the lower band.
How to Trade Using the Bollinger Bands Indicator
Now that you know more about the features of this technical indicator and can interpret its signals the right way, it is time to move further and look at some basic strategies that you can add to your arsenal. We are going to provide you with three interesting tactics that you can apply in most situations, regardless of whether a stock or a currency pair is trending or not.
Reversal Strategies
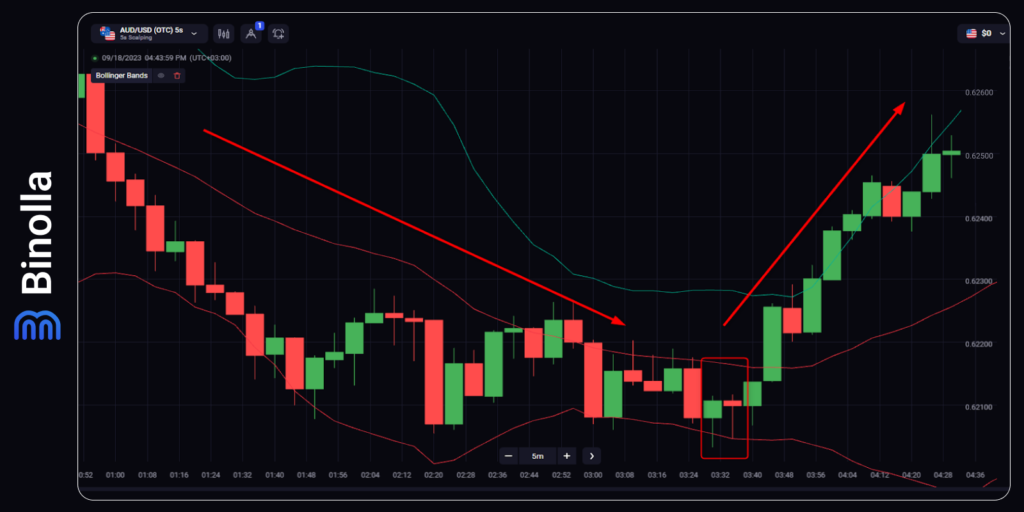
The first strategy that we would like to share with you is known as a reversal system. As you can read from the name, it allows you to find entry points during changes in trends.
In the example above, you can see that the price was moving downward for some time, and then, after hitting the lower band, it reversed and started a new trend. The point here is to be in time and catch this moment when the direction of the price switches from downwards to upwards.
Using BB solely is a good idea, but you can add candlestick analysis to your trading strategy and make it even more performant and precise. In this particular case, you have a hammer pattern, which allows you to assume that the price is likely to reverse. Therefore, with this confluence of signals, you can buy a Higher contract when trending digital options or simply purchase a currency or a stock.
Breakout Strategies
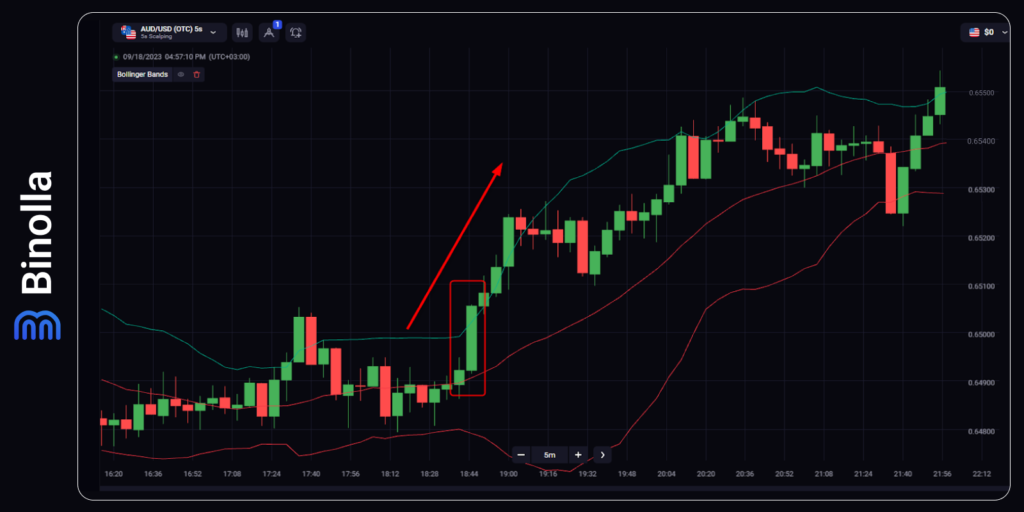
Another strategy that you can use when trading with the Bollinger Bands indicator is known as breakout. As it comes from its name, this system is based on boundary breakouts. In the example above, you can see the price hitting the upper band and going beyond it for a while, which is an opportunity to buy a currency pair, stock, or a Higher contract.
For FX traders, it is important to know when to leave the market. You can hold your position until the price remains beyond your boundaries. Or stay for longer if it remains above the simple moving average line.
Range Trading Strategies
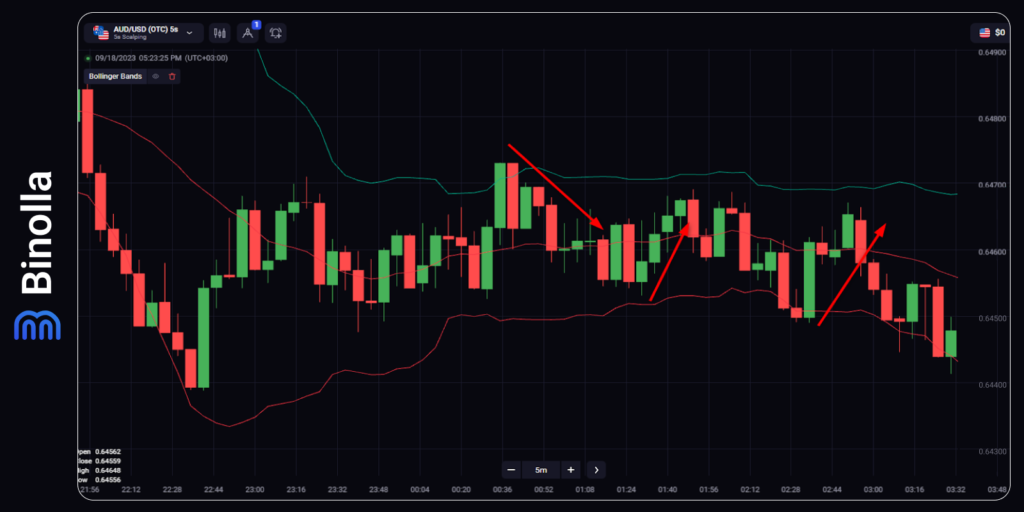
Apart from trend-trading systems, you can use BB to open trades when the price ranges within a narrow corridor. As you can see in the example above, the asset goes within bands touching the boundaries, and this is when your trading opportunities come to life.
This strategy is more than simple. When the price hits the upper band and reverses, you can buy a Lower contract or simply sell an asset, while after the price rejects the lower band, you can buy a Higher contract or merely buy an asset.
Bollinger Bands Explained: Video Guide
Secrets of Using the BB Indicator
While Bollinger Bands is quite a simple indicator, there are some recommendations that you can look at before you start using it:
- Try to use signal confluences, as this will help you get more precise signals. Use other technical indicators or drawing tools to augment your strategies;
- Use the parameters by default. While it may be tempting to play with settings, it is recommended to use default settings, as they were established by the man behind this indicator, John Bollinger. Changing periods and deviations may lead to unpredictable results;
- Wait for candlesticks to close before reading signals. Keep in mind that candlesticks’ shapes may change and the best solution is to wait for them to close before reading signals;
- Keep an eye on where the candlestick closes. If this happens inside bands after a candlestick hits one of the boundaries, this may be a reversal signal, while if it closes outside the indicator, this may indicate that the trend is continuing;
- By switching to shorter timeframes, you will get an early signal. This recommendation is of particular use for digital options traders.
Pros and Cons of Using the Bollinger Bands Indicator
BB has a lot of advantages, and we are going to outline some of the most interesting below:
- The indicator is great for checking the current volatility;
- It can be used for various types of assets, including currencies, cryptocurrencies, stocks, metals, etc.;
- You can apply it when trading digital options, CFDs, and other contracts;
- BB is great for finding entry points in many situations.
When it comes to disadvantages, they are the following:
- Bolinger Bands are rarely used alone. You should apply other tools to find better entry points;
- BB is a lagging indicator, which means that most signals come late. Therefore, you are risking missing some opportunities. Luckily, you have plenty of other technical analysis tools to make your trading even more profitable.
Conclusion
Bollinger Bands, or BB, is a famous technical indicator by Mr. John Bollinger, who is famous for its trading results. The tool allows you to see the current market volatility as well as the direction of price movements.
With Bollinger Bands, traders can find good entry points, but they have to work on their strategies to receive more precise signals. Most traders apply additional indicators or simply resort to the help of the candlestick analysis method in order to improve their results.
FAQ

What Do Bollinger Bands Do?
This is a volatility indicator that allows you to watch how active the price of an asset is at a particular moment. Moreover, Bollinger Bands allows you to understand the trend direction.
How Effective the Bollinger Bands Indicator Is?
The indicator is very popular among traders, which means they appreciate its effectiveness. However, you should never forget that none of the indicators are 100% reliable.
What Are the Weaknesses of Bollinger Bands?
The indicator has not only advantages but some weaknesses as well. In particular, it is lagging, which makes signals come a bit later.
Are Bollinger Bands Good for Intraday Trading?
Yes, it is. The indicator is good for many strategies, including intraday ones.

