Trading with Awesome Oscillator: A Detailed Guide to One of the Most Sophisticated Indicators

Plenty of technical indicators are available on the Binolla platform. Some of them are very popular and at the hearing. Others, while still very useful, are in the shadows. The indicator that is described in this article was designed by Bill Williams, a famous US trader who developed the famous Alligator system. By reading the following paragraphs, you will delve into the basics of this technical analysis tool as well as some basic strategies.
Benefit from a variety of technical indicators on the Binolla platform by creating an account right now!
Contents
Awesome Oscillator Basics
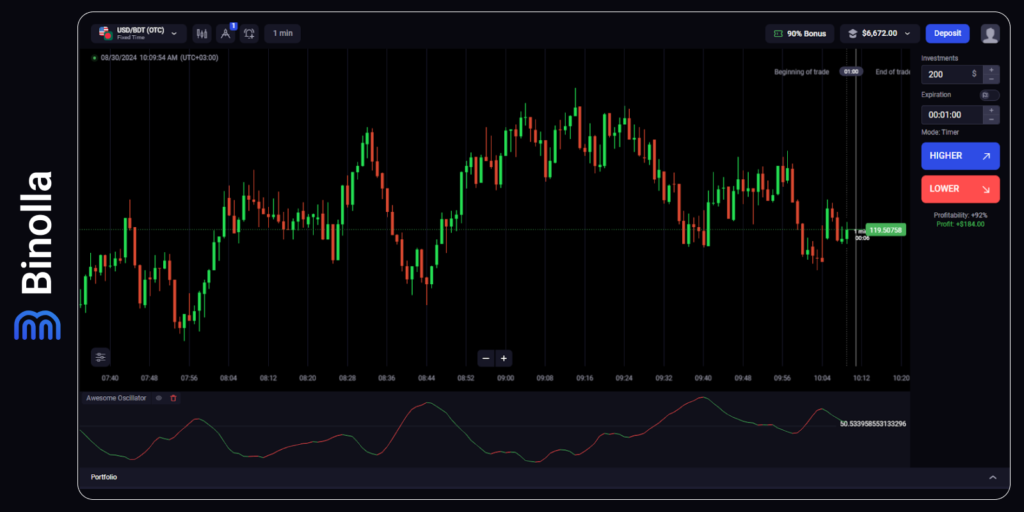
The Awesome Oscillator belongs to the momentum indicator group, which means that it generates reversal signals along trending and flat markets. The indicator can be applied to any market and financial instruments, including digital options, Forex CFDs, etc. While the indicator was initially designed to find market momentum and reversals, many traders use it to pinpoint trends.
Formula Behind the Awesome Oscillator Indicator
Knowing the formula behind the indicator is crucial as it will allow you to better understand how it builds the line. Even though you may never calculate it on your own, being aware of what is under the hood is crucial as you will understand how the indicator works.
To calculate the indicator line, you need to take the 34-period SMA and subtract it from the 5-period SMA. Even if you won’t do all these calculations on your own, now you know that the indicator is based on SMAs, which means that it smoothes price fluctuations and reduces price noise. This will help you find entry points as well as see smoothed price movement directions that will help you make more informed decisions.
Indicator Awesome Oscillator Settings
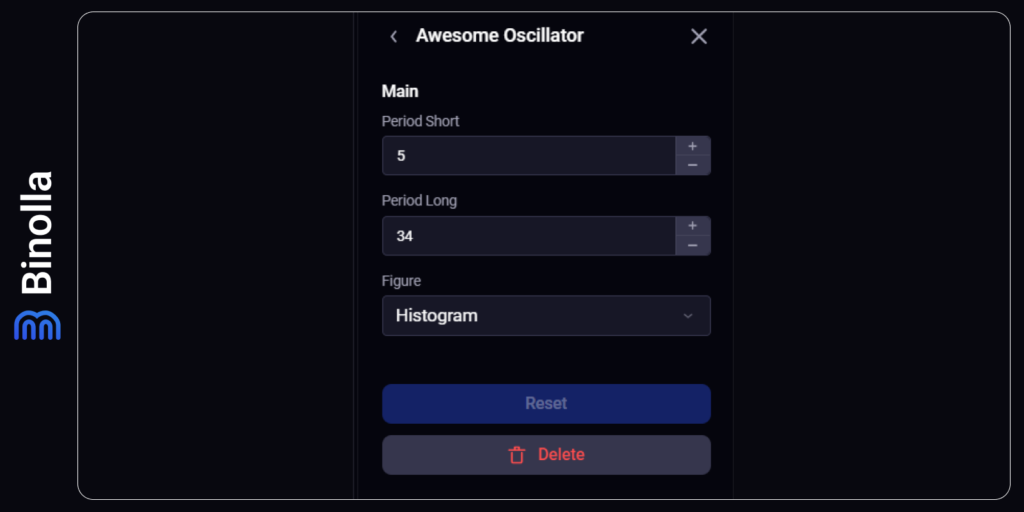
The indicator has two settings and you can choose the figure as well. The first one is a short period, which is set at 5 by default. This is a fast SMA that will react to the smallest price changes. It is recommended to use this period to make the SMA as flexible as possible.
The next one is SMA 34, which is also recommended to be left unchanged as this one reflects mid- to long-term price changes. Both make the indicator work better and see trends as well as find market reversals.
Reading the Awesome Oscillator
The indicator is presented in two forms. The first one is the line, which can be red or green depending on the situation. Another form is the histogram, which appears below and above the middle line. From now on, we are going to consider the histogram form as it is more informative and easier to understand.
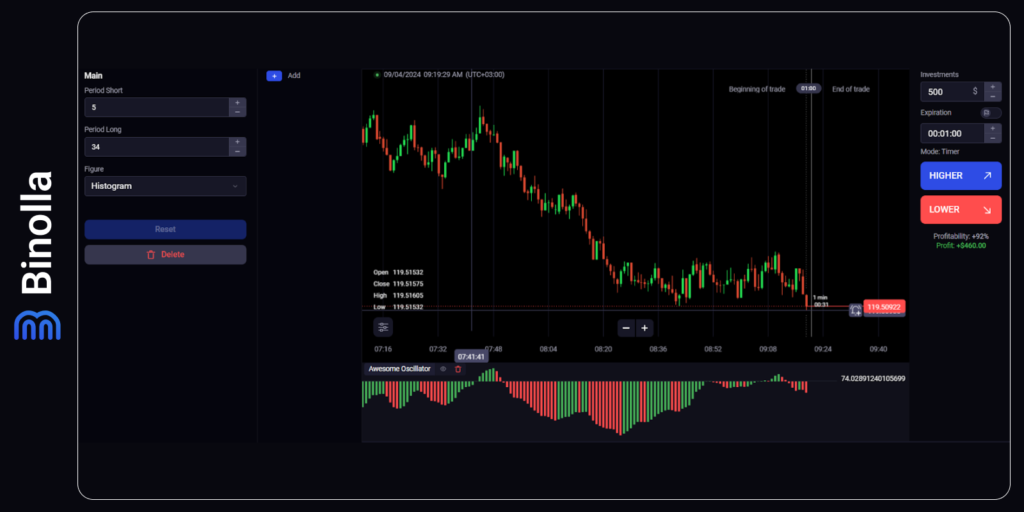
To select histogram, you need to open the indicator’s window and click Figure. Once you do that, you can choose Histogram. The indicator will change right away.
Reading the histogram is very simple. You will see green and red bars. The green one appears when the price is above the result of the indicator’s calculation, while the red one means that the price is below the results of the calculation.
The histogram appears both above the middle line and below it. When the histogram is below the middle line, it means that the price is in a downtrend and the bears dominate the market. Once the histogram moves above the middle line, the trend changes as the bulls gain control.
Awesome Oscillator Strategies: Top Trading Tactics for Beginners
Now that you know the basics and how to read the indicator, it is time to move further and delve into some interesting strategies that even beginner traders can work with. Keep in mind that the indicator can be used both solely and with some other technical analysis tools.
Awesome Oscillator Line Crossover Strategy
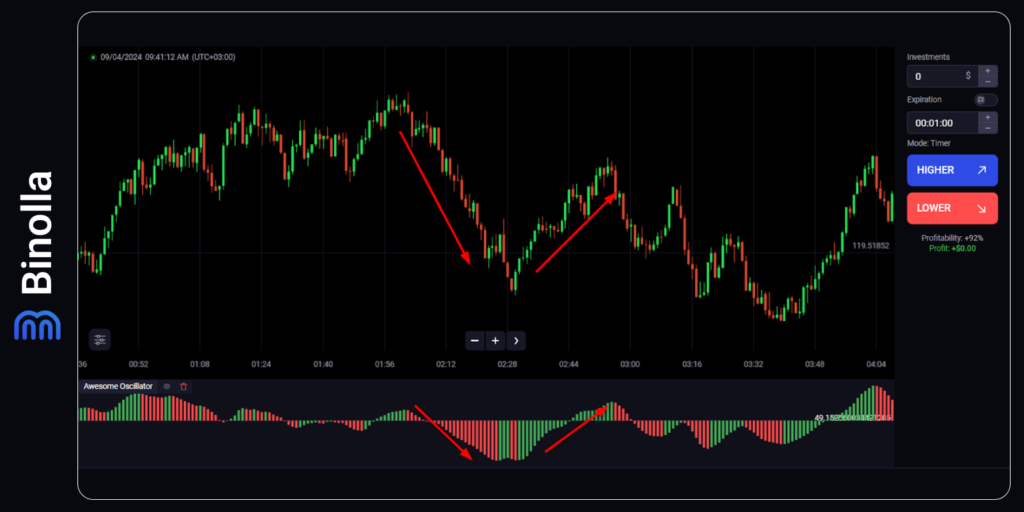
The first simple strategy requires minimum effort from a trader. You need to watch the moments when the indicator crosses its middle line. Once it happens, you can act accordingly. In this particular example, we have outlined two crossovers.
The first one is when the histogram crosses the line and moves lower. Once it happens, a trader can buy a Lower contract or sell a currency pair/stock. The deal should be opened once a pile closes below the middle line.
Keep in mind that due to the lagging nature of this indicator, the signal may not be clear. FX traders can also use this strategy to find exit points. To do that, they need to observe the histogram and leave the market once the piles form no lower lows anymore.
The second example is when the histogram moves above the middle line. As you may guess, this is a signal to buy a Higher contract or to purchase a currency pair/stock/cryptocurrency. Similar to the previous case, the signal may not be clear as the Awesome Oscillator is a lagging indicator. FX traders can find exit points when the histogram makes no new higher highs.
Awesome Oscillator Swing Strategy
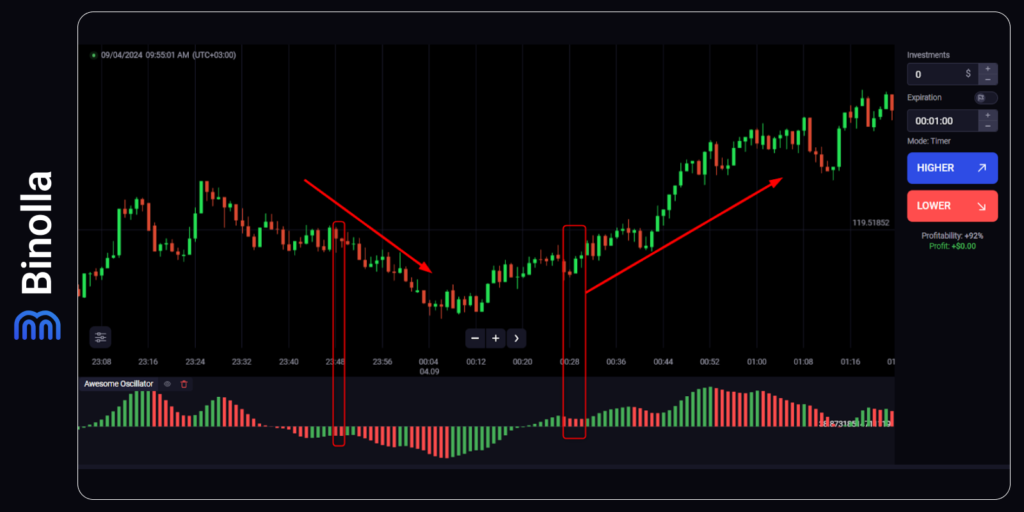
The next strategy allows you to use the classic swing trading approach to capitalize on price fluctuations. This method requires a trader to catch the moment when the indicator is above or below the middle line. If it is above, you should find when green piles are followed by at least two red ones. After the green one appears again, you can buy a Higher contract or purchase a currency pair, stock, or cryptocurrency.
The opposite situation is when the histogram is below the middle line. If it is confirmed, you should search for at least two green piles to open a position. Buying a Lower contract or selling an asset is recommended after the first red pile appears.
Two Highs and Two Lows
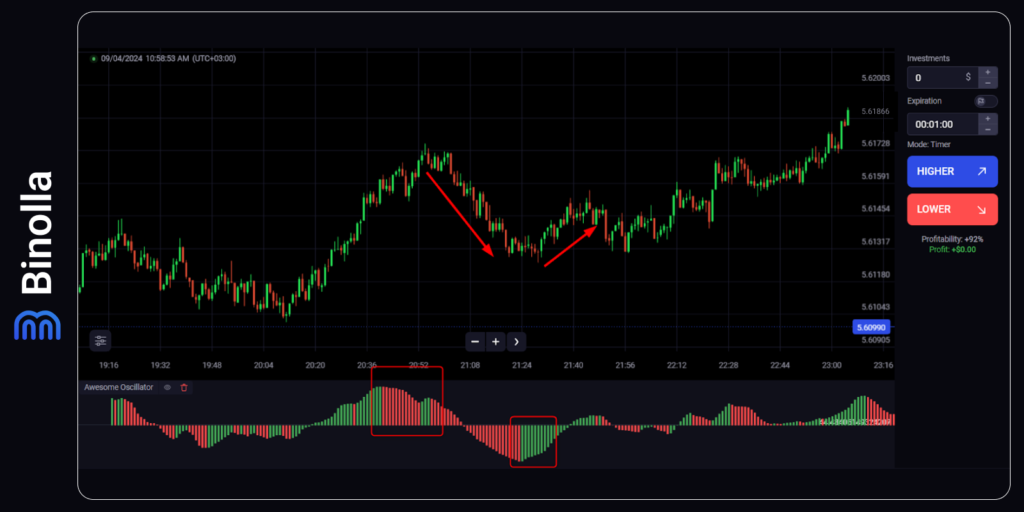
Again, this strategy is based on the histogram. To use it, you need to watch the indicator in total and seize the moments the idea behind this approach is to find two decreasing highs when the indicator is above the middle line and two increasing when the histogram is below the line.
When the histogram is above the middle line and there are two decreasing peaks, then you can buy a Lower contract. However, with this strategy, signals are not precise as there is no trigger. Therefore, this approach is better used by FX traders when the price tests the resistance level and steps back. Market participants can sell an asset.
Once the histogram plunges below the middle line, and then begins to grow with the two consecutive increasing lows, you can buy a currency pair, stock, or cryptocurrency. As it was already mentioned, this approach is not 100% suitable for digital options traders as there are no precise signals.
Divergence Awesome Oscillator Strategy
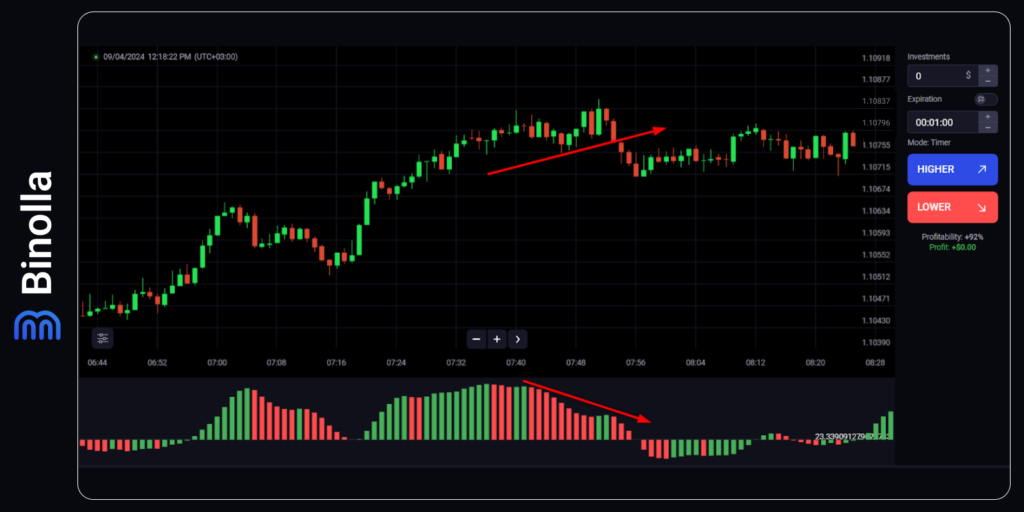
Divergence is one of the most popular approaches that most traders use to find market reversals. The idea behind it is to find divergence between the indicator and the price. In our example, the bearish divergence occurs when the price still makes new higher lows while the indicator’s highs are decreasing. Traders can sell an asset once the ascending trendline is broken. When it comes to digital options traders, they can buy a Lower contract in this case.
Another example of divergence is when the price makes new lower highs, while the indicator demonstrates higher lows. This is known as bullish divergence and you can buy a Higher contract or simply purchase an asset.
Combining Awesome Oscillator with Other Indicators
Awesome Oscillator is a powerful tool even when used alone. However, it provides even more opportunities when combined with other technical indicators.
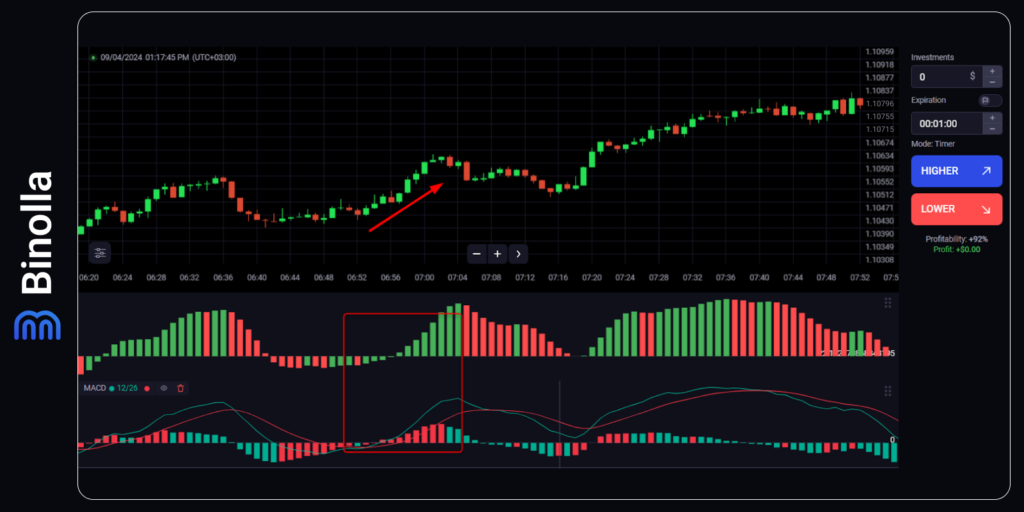
Here is an example of using both oscillators. While they may seem similar, they are based on different calculations and allow traders to use them both to strengthen their strategies. In this particular case, we can use the MACD crossover, which provides traders with a buy signal (they can purchase Higher contracts). However, in order to make sure that the situation will develop in the trader’s favor, they can look at Awesome Oscillator. In this case, the indicator crosses the middle line and moves higher, which confirms the buy signal.
Therefore, once this happens, you can buy a Higher contract or purchase a currency pair/stock. Keep in mind that with this strategy, you can also find exit points for your Forex CFD trades. To do that, simply wait until another opposite crossover takes place.
Awesome Oscillator and ADX
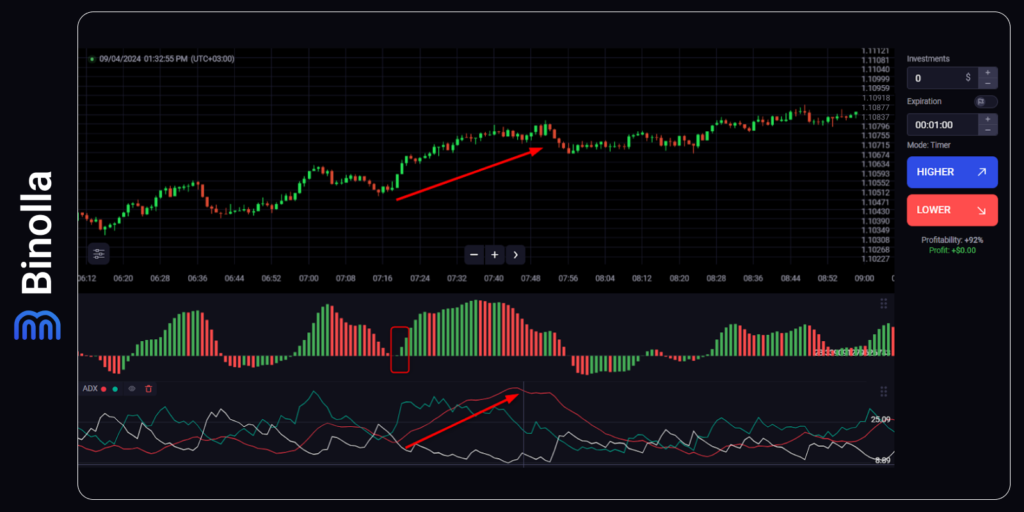
Another example of combining indicators is when a trader adds ADX. The latter is famous for showing trend strength, which can be used by Forex CFD traders when they look for closing trades. Once the signal from Awesome Oscillator comes (green piles above the middle line), a trader can buy an asset. Next, they need to follow the trend and wait for the ADX red to slope down. Once it happens, the market participant can close the trade.
How to Add the Awesome Oscillator Indicator to the Binolla Platform
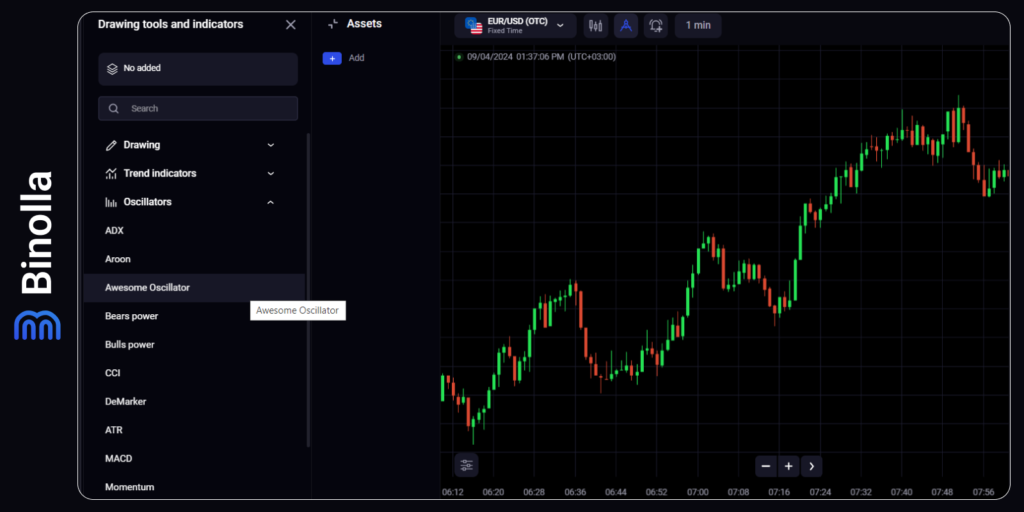
How to add the indicator to the Binolla platform
To add the indicator to the Binolla platform, one needs to do the following:
- Find the Tool button at the top of the platform and press on it.
- Click Oscillators in the toolbox that appears on the left side of the platform.
- Find Awesome Oscillator there.
- Click on the indicator to add this.
Advantages and Disadvantages of Awesome Oscillator
The indicator offers both advantages and disadvantages to digital options and Forex traders. Find the most interesting positives that you will enjoy when using this technical analysis tool:
- Easy to use. The indicator is located below the main chart and is presented in the form of a line of histogram. Wherever you choose, you will find it very simple to read and use;
- Helps find market reversals. With Awesome Oscillators, traders can easily identify market reversals. When the indicator plunges below its middle line, the downtrend is confirmed, while when the histogram or line crosses the middle line from below, the uptrend is confirmed;
- Visual perception. Awesome Oscillator is presented in the form of a line or histogram. This makes it easier to find trading signals;
- Multi-timeframe indicator. The technical analysis tool can be used across various timeframes;
- It can be combined with other indicators. While Awesome Oscillator can be used alone, in some cases, it is better to add at least one more technical analysis tool to enhance signals.
When it comes to drawbacks, they include:
- Lagging indicator. While Awesome indicator is an oscillator, there is a lag between the price and the histogram. This may result in delayed signals. Therefore, when using it, you can miss part of the movement;
- Limited use. Similar to many other indicators, this one can be used solely, but to get the most out of it, one can add another indicator;
- False signals. If the price remains within a tight range, the indicator produces a lot of false signals;
- Can’t predict future trends. Like many other oscillators, Awesome Oscillator does not predict future price movements.
FAQ

What is the Awesome Oscillator and What a Trader Can See By Using It?
Awesome Oscillator is a technical indicator designed by Bill Williams. It provides information about the current price momentum. With the indicator, traders can find reversal signals.
How to Interpret Awesome Oscillator in Trading?
The indicator provides traders with several types of signals. For instance, if the histogram moves above the middle line, an upside reversal occurs, while when the histogram plunges below the middle line, a sell signal occurs.
Can I Use the Awesome Oscillator Indicator Alone?
Yes, you can. The indicator provides signals allowing traders to make informed market decisions. However, to augment your trading system, you can add various indicators to increase the performance of your tactics.
Does Awesome Oscillator Provide Reliable Signals?
Awesome Oscillator can be considered a reliable technical analysis tool. However, you should understand that this indicator is lagging, which means that signals come with a delay. Therefore, when trading Forex CFDs, you can lose part of the price movement.


