Top 9 Binary Options Trading Tools You Need in 2025
Traders can use a variety of tools to trade digital options successfully. Some of them can be used to analyze prices in technical analysis, while others will help you make informative decisions based on various news. With many various trading tools, one may have difficulties picking the most useful ones. By reading this article, you will discover the most popular tools that professional digital options traders use in their strategies.
Want to start trading digital options now? Create an account at Binolla and pave your way to success!
Contents
1: Technical Indicators
One of the most important tools for traders is technical indicators that allow market participants to analyze current prices and find entry points. Therefore, a good trading platform should provide market participants with several indicators including the most popular trend and momentum tools.
What are technical indicators? They are special analysis tools that are based on math calculations. They allow market participants to pinpoint trends, find oversold and overbought conditions, see the current trend strength, or even understand volatility and seize market volumes.
For instance, if we take a simple moving average, it calculates the average price for a particular period. Each average price is a dot, and all these dots are connected by a line. This indicator is widely used by traders to pinpoint market trends. The direction of the line aligns with the direction of the price movement.
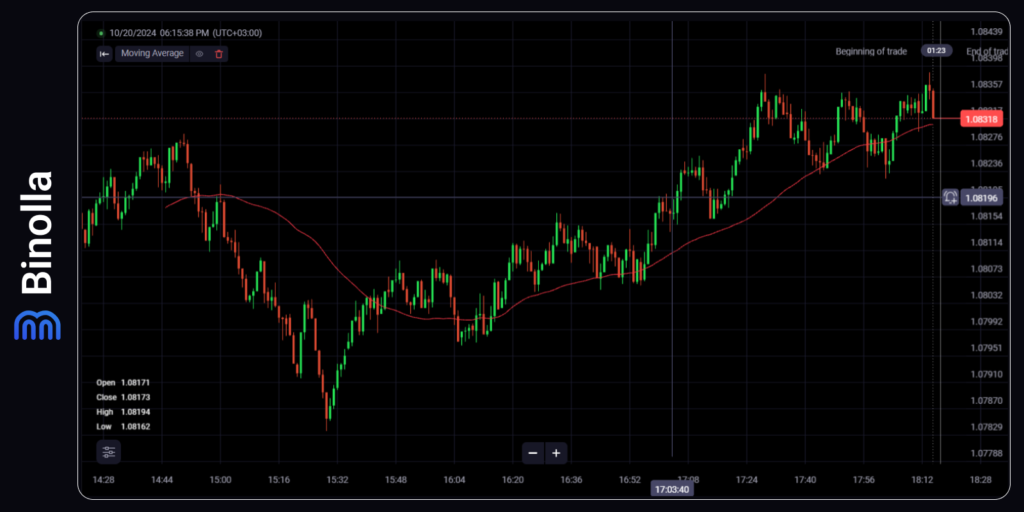
How many indicators should a platform contain? A good trading terminal should provide at least all classic technical indicators. The list should include moving averages, Bollinger Bands, Keltner Channels, Relative Strength Index (RSI), Stochastic, MACD, Average True Range, and more. If they are in place, you will have all you need to make informed trading decisions and apply various strategies.
2: Drawing Tools
The top 9 digital options trading tools you need in the 2025 guide will be incomplete without mentioning drawing tools. Not all traders use technical indicators or, at least, they add technical indicators to their price action strategies. Therefore, the number three of this Top is drawing tools.
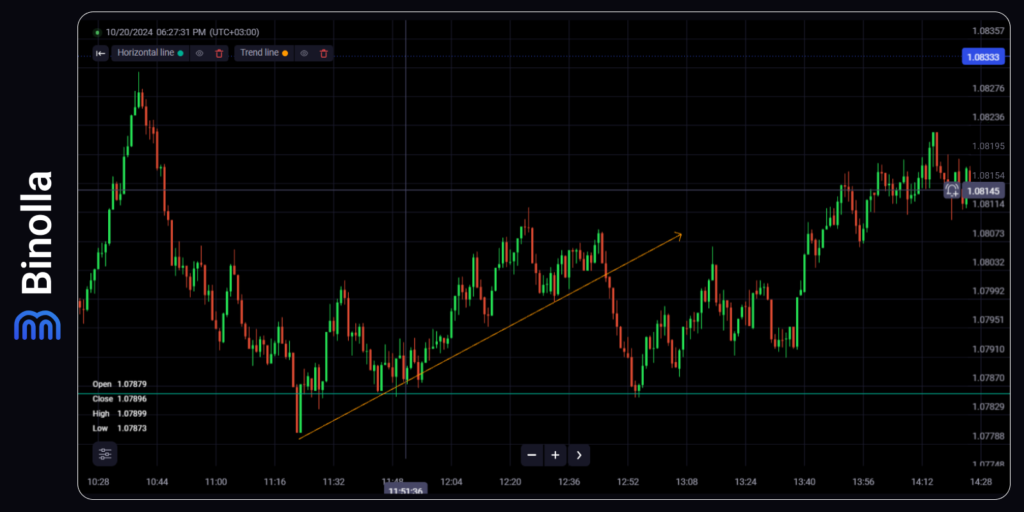
What are drawing tools? These are lines that traders use to underline support and resistance levels, and trends, as well as some complex ones that allow market participants to understand the current market context.
For instance, support and resistance lines demonstrate the shift in market sentiment. The support level is where sellers lose domination and buyers take control. The resistance level, in turn, shows where bears take control of the market and bulls lose power. Knowing these areas allows market participants to understand where the price may reverse, consolidate, or begin a correction.
Trendlines, which are also presented on the Binolla platform, allow market participants to understand the current price direction. This, in turn, gives you valuable information on whether to buy Higher or Lower contracts. For instance, if you have drawn an ascending trendline as the price lows become higher, then it is better to stick to the strategy of buying Higher contracts. On the contrary, if you have drawn a descending trendline through lower highs, then the strategy will be to buy Lower contracts when a signal appears.
3: Charting Types
Charts are another important tool that all digital options traders use. Choosing between them depends on your trading strategy and preferences. The most popular ones are Japanese candlesticks, bars Heikin Ashi, and lines. Which one to choose? It depends mostly on your strategy.
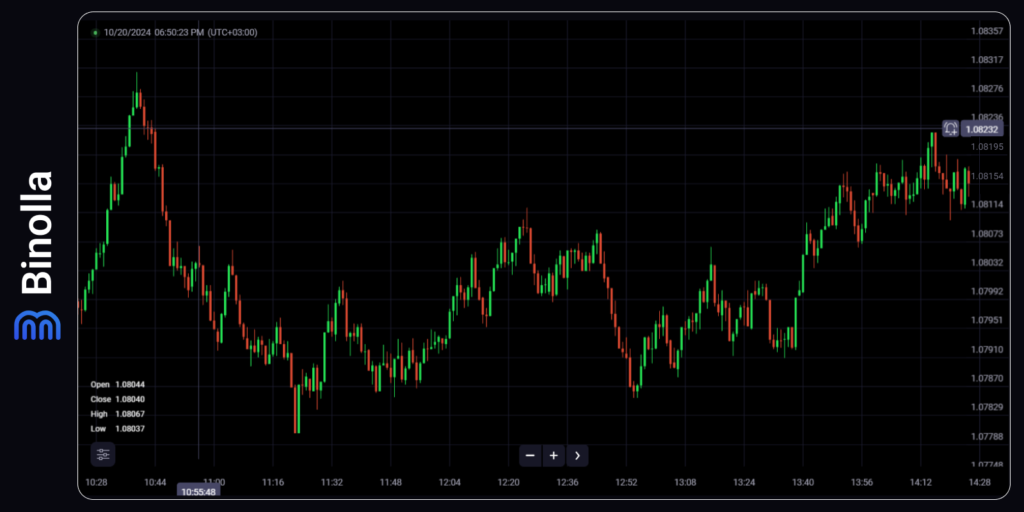
For instance, Japanese candlesticks, bars, and Heikin Ashi are better used when you need more information about the price for a particular period. They demonstrate OHLC price, which can be useful if you want to rely on naked price when making trading decisions.
Lines, in turn, are dots that are connected by a line, which demonstrates the current price only. While this type of chart is less informative, it has its advantages. For instance, lines are better used with price action as they are not as noisy as Japanese candlesticks. Therefore, lines can be applied to draw levels, and trendlines, and define such patterns as double top/bottom, head and shoulders, triple top/bottom, and many more.
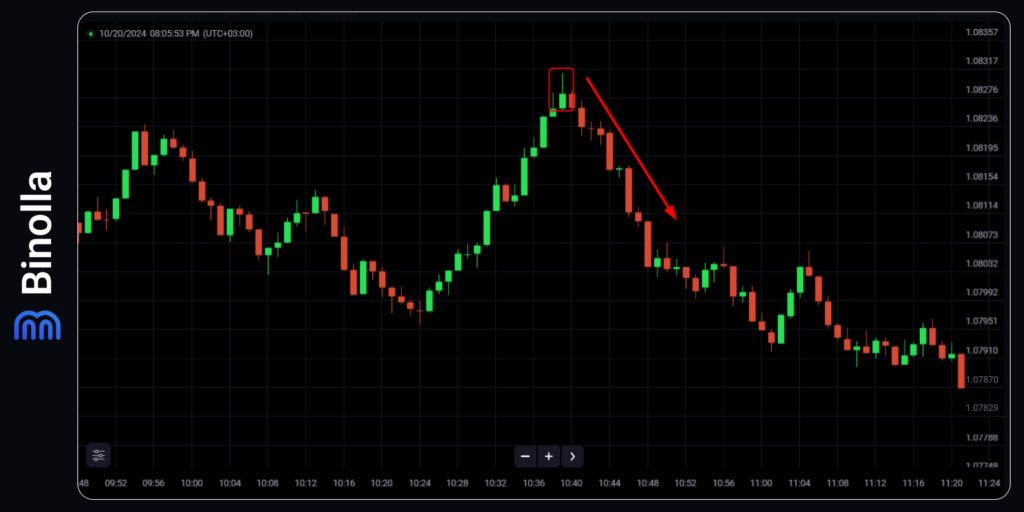
Japanese candlesticks are used by traders not only to see the price or receive more information from charts. This type of charting offers a whole trading system, which offers several patterns allowing market participants to find reversals, corrections, or trend-continuation setups.
In the example above, we use a single-candlestick pattern that allows us to forecast market reversal. The shooting start pattern tells traders that the uptrend may end and a downtrend may begin. Traders can buy a Lower contract when this candlestick closes.
4: Economic Calendars
Whether you are using macroeconomic news or events in your trading or not, adding economic calendars to your trading routine will be the right solution. Such news and events may significantly impact price fluctuations. Moreover, sometimes even the most evident patterns or indicator signals may be broken if the data release or a comment from an official does not meet market expectations.
Therefore, using economic calendars is crucial for digital option traders who trade news and those who do not use news trading strategies. For the first group, macroeconomic data and events are sources of signals.
For instance, a trader wants to trade on the US CPI data, which is expected to be below the current inflation rate. This means that the US dollar is likely to grow against other currencies. A trader buys a Lower contract for EUR/USD at the moment of publication and capitalizes on the price drop.
The second group may not pay attention to data and forecasts. However, traders who rely solely on technical analysis should check whether there are important data releases or not before they are going to buy a digital option contract.
If you want to trade EUR/USD, for example, and there are no key data reports within your expiration period, then you can open a trade based on your technical analysis results. However, if you are going to buy a contract and some of the important data releases will be published before your expiration, it may be better to avoid a trade.
5: CME FedWatch Tool
This tool can be useful to those traders using fundamental analysis in their trading sessions. The CME FedWatch tool was designed by the Chicago Mercantile Exchange and serves as a kind of barometer of social opinion about the upcoming Federal Reserve decisions.
By using this tool, you can see the consensus of opinions of traders and investors about the interest rate decisions that the Fed is going to make during the upcoming meetings. What is important about this tool is that you can see the percentage of investors and traders who are sure that the interest rate will be cut or hiked by a certain number of basis points.
How to apply it? Imagine that you look through this tool on the eve of the next meeting. About 85% of respondents expect the Fed to cut rates in the range between 25 and 50 bps. Then you can expect that the Fed will take a decision to switch to expansionary monetary policy. When the rate is announced, you can buy the US dollar against other currencies.
One of the advantages of this tool is that you can see the market sentiment for quite a long period. This allows you to plan your trades in advance.
6: Backtesting Tools
Testing your strategy is one of the essential preparational stages. Each time you adopt a new trading system or adjust the current one, it is better to spend some time and test it. Digital options traders can use the demo mode on the Binolla platform, which is unlimited and flexible.
Why using the demo account (backtesting) in digital options:
- Making first steps with a new platform. Traders can use backtesting to try a new platform and its features without putting their own money at risk. This will allow them to prepare themselves for real trading and better learn the interface and functionality of the terminal before placing a first real-money trade;
- Checking technical indicators. If you are not familiar with a particular technical indicator, then you can add it and try to trade with it in a risk-free mode;
- Grasping drawing tools and price action. Even if you have found your favorite price action pattern several times on the chart, it is better to try to trade it in real-time so that you can better understand the rules. Doing it in the demo mode will allow you to eliminate any risks;
- Improving your performance. Using a demo account as a backtesting tool may help market participants improve their performance in markets where they feel uncomfortable or weak. This, in turn, will help traders enlarge their set of assets.
7: Trading Platform
Modern online trading is impossible without a trading platform where you can not only place trades, but also conduct technical analysis and follow your trades. A trading platform should be both functional and offer a friendly interface. This should be comfortable software especially if you are trading digital options so that you spend less time looking for appropriate buttons.
In an ideal world, traders should have all buttons and input fields at hand so that they spend seconds preparing and opening a trade. If we take the Binolla platform, for instance, it may have some minor drawbacks, but it is close to an ideal trading terminal as it was developed by traders and for traders.
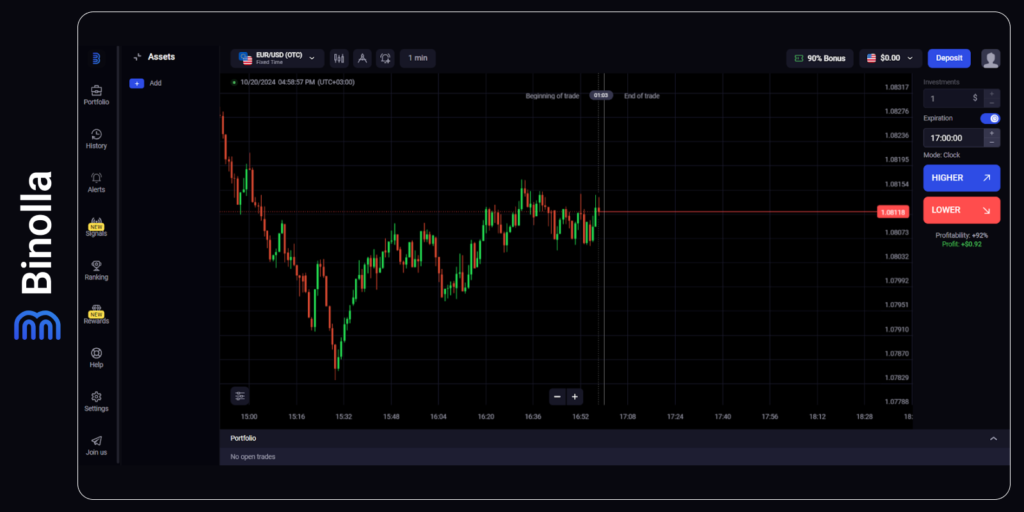
If you are looking for a decent trading platform right now, then you can focus on these criteria:
- Ease of use and friendly interface;
- Range of assets;
- Availability of technical analysis and drawing tools;
- Chart customization options allow you to change the color and appearance of the chart to improve visualization and perception;
- Possibility to choose between various types of charting;
- Wide range of expiration options;
- Plenty of payment methods that allow users from various regions to conduct deposit and withdrawal operations seamlessly;
- Bonuses to boost trading opportunities;
- Additional features that may include various rewards for various trading achievements that make the whole process even more attractive and interesting;
- 24/7 customer support service.
The Binolla platform meets all these criteria. Here you can find a variety of analysis tools, chart customization, 4 types of charting, flexible expiration options, lucrative 90% bonuses for all new traders, and generous rewards for active market participants.
8: Currency Correlation Tool
Professional traders always use diversification in order to succeed. Trading a single currency pair or any other type of asset may be profitable. However, by diversifying your trading portfolio, you can increase your chances of making more sustainable profits.
When trading Forex currency pairs, you can use a tool that shows a correlation between various assets of this type. Correlation allows you to pick currency pairs that move in the same (or the opposite) direction. The correlation can be either positive or negative. The positive correlation tells you that two or more assets go in the same direction, while the negative one means that two or more assets go in the opposite direction.
Correlation is presented in percentage. The higher the percentage is, the more correlated the chosen assets are. For instance, if EUR/USD and GBP/USD trade with a high correlation percentage (like 80% or 90%), then you can expect both currency pairs to have the same trends. The lower the correlation percentage, the less likely currency pairs will trade in the same direction all the time.
It should be mentioned that correlation is not static. This means that it changes all the time. Two currency pairs can have different correlation percentages over time. For instance, at one moment, the correlation between EUR/USD and GBP/USD may reach 75%, while later, it can fall to 60%. However, a negative correlation between these two currency pairs is almost impossible most of the time.
9: Trading Journal
Keeping records of your trades is a good habit as it allows you to systemize your trading routine. Moreover, it prevents overtrading and allows you to stay disciplined all the time. After a trade is closed, you can add all its parameters to your trading journal, including the strategy and your psychological state. In the future, when revising your trades, you will be able to find great insight and avoid mistakes in your upcoming sessions.
Moreover, you will spend some time keeping records. This will prevent you from opening revenge trades. Which information should be added to a trading journal? There is no standard journal, but on average, you can include the following points there:
- The level where you have bought a contract;
- The amount of investment;
- A type of signal that you used to buy a contract;
- Market context (the price was close to a particular level, there was a trend or sideways fluctuations);
- News context (the deal was opened prior to or after the release of an important data set/event);
- Psychological state;
- Money and risk management rules that were applied.
What are the conclusions that you can make when using a trading journal?
- Change the amount of investment according to your trading results over a period;
- Change the expiration time (increase or decrease according to your strategy);
- Avoid trading at some periods or, conversely, trade at some periods (when important news is released, for instance);
- Change one or several elements of your trading strategy, adjust its parameters, or even switch to another strategy;
- Do not trade on some days of the week or, conversely, trade on some days of the week, and so on.
FAQ

What Tools Do Traders Need?
Traders need a trading platform to be able to place trades online, technical indicators and drawing tools to analyze markets, economic calendars to follow the latest and upcoming events, as well as a demo account, and a trading journal to keep records of their deals.
Should I Use Market News in Trading?
Whether you use market news or not, it is recommended to know when important data is released as such publications may bring significant volatility to the financial markets.
Are These Tools Free or Paid?
All the tools that are described in this article are totally free. You can start using them right away without paying any commission.
Which Tools Can Traders Do for Daytrading or Scalping?
The best tools for day trading or scalping are technical indicators and candlestick patterns. They allow market participants to seize a lot of opportunities throughout the day.


