Top 8 Scalping Indicators Every Trader Should Use
Scalping is a high-frequency trading style that involves opening short-term positions that last from seconds to minutes. To succeed in scalping trading, you need to have the highest level of concentration, fast decision-making, and even intuition. Moreover, you need to have a good strategy that will allow you to receive precise signals. In this article, we’ll delve into the most popular indicators for scalping. We will also show you some interesting strategies that you can apply when adding them to your trading sessions.
Looking for a good brokerage to use for scalping strategies? Join Binolla and enjoy high execution speed across a broad range of assets!
Contents
Key Takeaways
- Scalping is a fast-paced trading style that allows traders to capitalize on smaller price movements.
- Scalping has different types that you should know before delving into trading.
- Top indicators for scalping allow you to receive precise signals with well-timed entry and exit.
- Breakout strategies are the best for scalping as they allow you to catch significant price momentum.
- You should weigh both the advantages and disadvantages of scalping before placing your first trade.
Scalping Basics
Scalping is a common name for a variety of strategies. Traders aim at capitalizing on small price movements. Market participants look for strong short-term price momentum to generate minor profits. By opening a lot of trades throughout the day, traders can make serious gains. There are three main types of scalping that you can use:
- HFT or high frequency trading. This type of scalping requires opening and closing trades within seconds when the spread is the lowest. Traders can generate from a couple to several dozen pips when using this approach.
- Pips catching strategies. This is another type of scalping that requires market participants to open trades and hold them for up to a couple of minutes.
- Standard scalping trading. By using these strategies, you can hold your trades from 5 minutes to up to one hour. This type of scalping is the most popular one as it is similar to standard trading strategies, less nervous, and can be traded with standard strategies that market participants use when applying other styles.
- 5s digital options scalping. This type of contract is available on the Binolla platform and allows you to capitalize on minor price fluctuations withing the upcoming 5 seconds.
Top Indicators for Scalping
Most basic technical indicators can be applied to various types of scalping. Such indicators are of different types, they can be trend-following and oscillators. The first type is normally used to identify trends, while the second provides traders with information about a possible reversal or a correction in advance. Here are some of the most popular trading indicators that scalpers can apply in their strategies.
1: Relative Strength Index or RSI
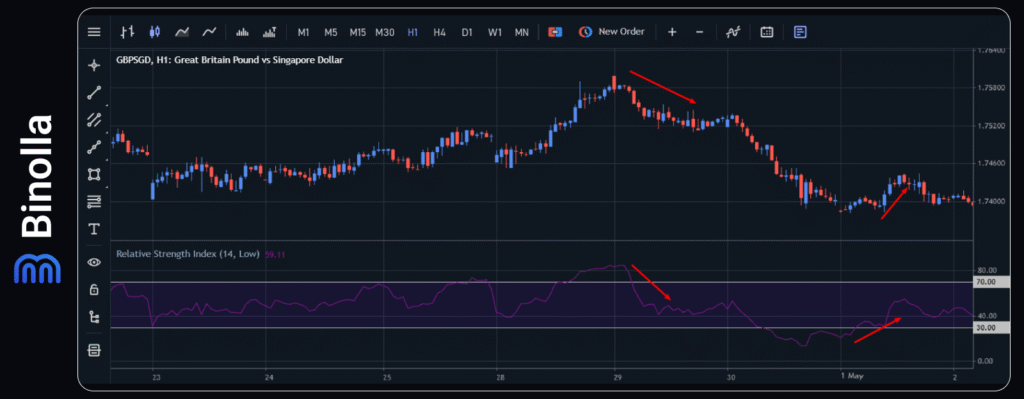
The Relative Strength Index helps traders identify overbought and oversold areas to find where the price may reverse or begin a correction. The indicator works on all timeframes, including the minor ones. It has two lines, 30 and 70, that help market participants understand whether the price is oversold or overbought. Some traders can set 20 and 80 as overbought and oversold lines, but in this case, they reduce the number of signals.
To buy an asset when using this technical indicator, you need to wait until the price moves below 30 and then returns above this level. You can place a stop loss order below the minimum level of a candle at which the price breaks 30. Conversely, when the price moves above 70 and then returns below this level, you can sell an asset. A stop loss order can be placed above the candle at which 70 was broken.
Digital options traders can buy a Higher contract when the RSI indicator leaves the oversold area (moves above 30) or purchase a Lower contract when the line breaks below 70.
S.Bajaj, Top Binolla Trader
RSI is among the best indicators for scalping. This is the main technical analysis tool that I use in my strategies. It is very simple and provides straightforward signals. Moreover, RSI allows you to find reversals in advance as signals appear before the price begins to move in the opposite direction. The RSI gives me about 60% of profitable signals, which is quite enough to maintain a high level of profitability. What I like about RSI even more is that when using scalping strategies, I don’t need to add any other technical analysis tool to confirm signals.
2: Bollinger Bands
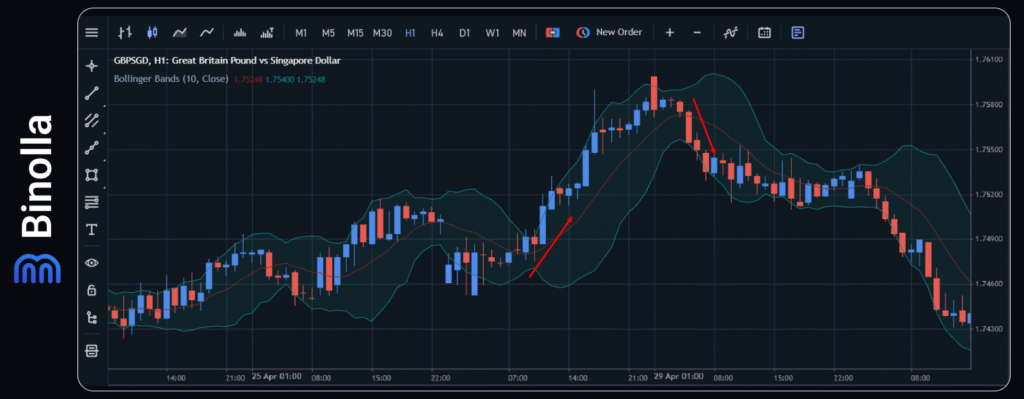
An example of a scalping strategy with Bollinger Bands
The Bollinger Bands indicator is among the most popular trend-following technical analysis tools. It is based on moving averages. The channel that is formed by these moving averages also allows you to see the market volatility. Scalpers can use it in their strategies when the price moves above or below the middle line.
This strategy allows you to quickly react to market changes and catch a part of the trend movement with a high level of precision. As you can see on the chart, when the price moves below the middle line, a momentum appears and you can sell the asset. Conversely, when the price breaks above the middle line, an upside momentum occurs, allowing you to buy an asset and generate profits on the upside price movement.
Those trading digital options can open a Higher contract when the price breaks above the middle line. To purchase a Lower contract, you need to wait until the quotes break below the middle line.
Ali M., Top Binolla Trader
Bollinger Bands is among my favorite indicators. I like it for providing clear signals, especially when I use scalping strategies. The momentum that occurs when the precise breaks the middle line is enough to catch 10-20 pips, which is enough. However, what I dislike is that there are few signals, especially when the volatility is high or the market is trending.
3: Stochastic Oscillator
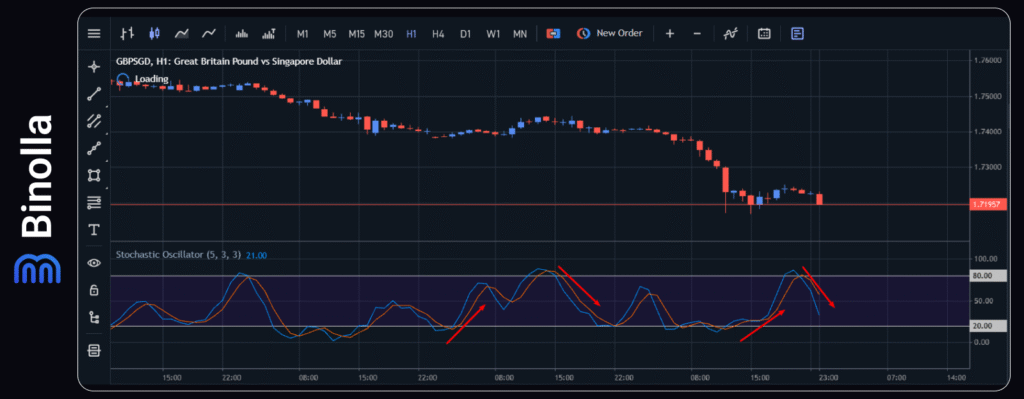
An example of the Stochastic oscillator
The indicator is among the most popular ones, as similar to RSI, it offers clear and straightforward signals when the price reverses. Traders can find overbought and oversold areas and trade accordingly. Stochastic can be an ideal indicator for scalping as it allows market participants to react to any market changes almost instantly.
A sell signal comes when both lines of the Stochastic oscillator cross 80 from above (the price leaves the overbought area). On the other hand, when both lines of the indicator go above 20, then a trader can buy an asset. When trading digital options with this indicator, you can purchase a Higher contract when both lines break above 20 and a Lower one, when they move below 80.
James Plunt, Top Binolla Trader
Stochastic is quite a reliable technical indicator with a lot of signals that I can get throughout the day. The fact that the overbought and oversold lines are at 20/80 makes the signals more reliable. I think this indicator is ideal for scalping and a good alternative for RSI.
4: Parabolic SAR
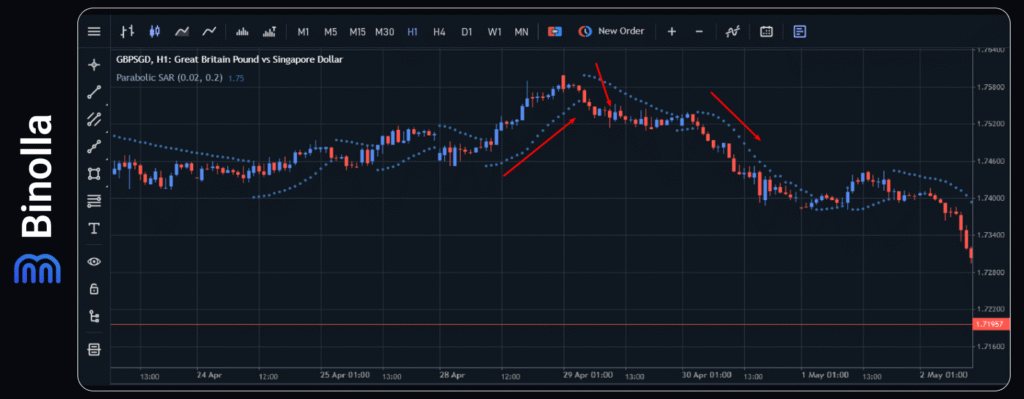
Parabolic SAR is often used by traders to find exit points when dots shift position. However, scapers can use it to find entry points as well. The idea behind this approach is simple. When dots start building above the price, sell at the third dot. When dots appear below the price, buy at the third dot. One of the benefits of this indicator is that you can find exit points as well. If you buy when the dots are below the price, then you can close the trade when they shift the position and appear above the price. To close a sell position, you should wait until the dots go below the price.
Digital options traders can use the same strategy to buy contracts. They open Higher positions when three dots appear below the chart and Lower ones when the three dots appear above the chart.
Joshua M., Top Binolla Trader
I often use Parabolic SAR, as this is a very simple indicator requiring no previous experience. While most beginners try to trade the first dot, I use the third to open a position, which makes this strategy even more reliable. The strategy allows you to quickly enter the market. In some cases, I add RSI or other momentum indicators to filter signals. However, you should keep in mind that using two or more indicators may slow you down.
5: Commodity Channel Index
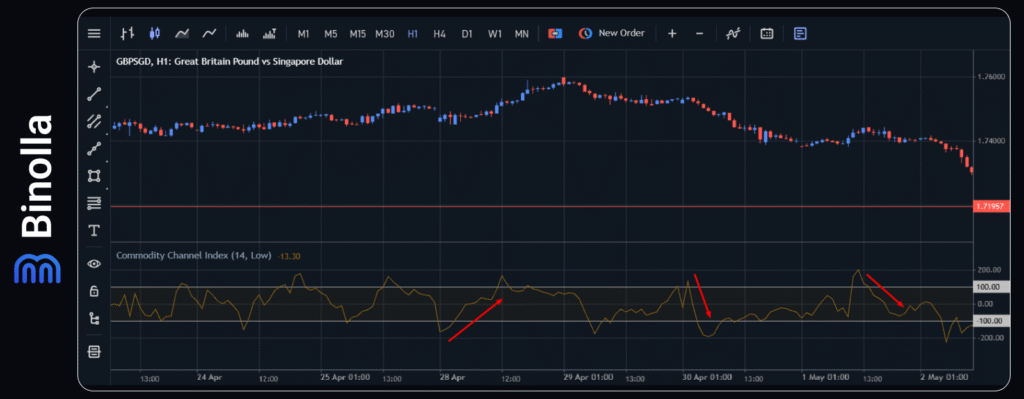
The indicator fluctuates between 100 and -100 most of the time. However, when the indicator line moves beyond these levels, you can make preparations for trading. When the price is above +100, then you can prepare to sell.
The signal comes when the price moves below this level. On the other hand, when the price is below -100 and moves above this level, you can buy. Trading with this indicator looks similar to strategies with RSI and Stochastic. While CCI is designed to identify potential turning points and RSI is used to see the momentum, in this case, the two indicators show the same signals.
This indicator allows you to buy digital options as well. Open a Higher contract when the line moves above -100 and a Lower when the indicator breaks below +100.
6: MACD
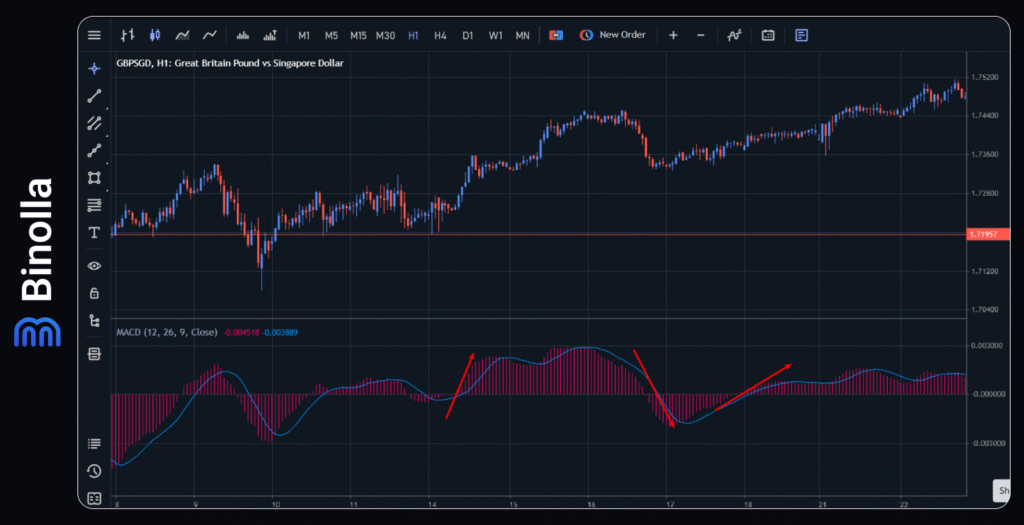
MACD is used in many strategies as it provides traders with different types of signals, including divergences. However, for scalping trading, we use only one type of signal, when the histogram moves above or below the zero line. Traders can buy when the histogram breaks above 0 and sell when the histogram breaks below 0.
Digital options traders can use this indicator the same way. To buy a Higher contract, you need to wait until the histogram breaks above 0 and a Lower contract when it goes below 0.
Jose S., Top Binolla Trader
The histogram strategy is among my favorite ones. Even if I lose part of the movement, the signal is still strong, and I can get about 10-12+ pips for sure. The only signal that I use is when MACD goes above or below the zero line. However, you can also use early signals when the line of the indicator crosses the histogram. This signal comes earlier, but it is not as reliable as when the histogram moves above or below the zero line.
7: Ichimoku
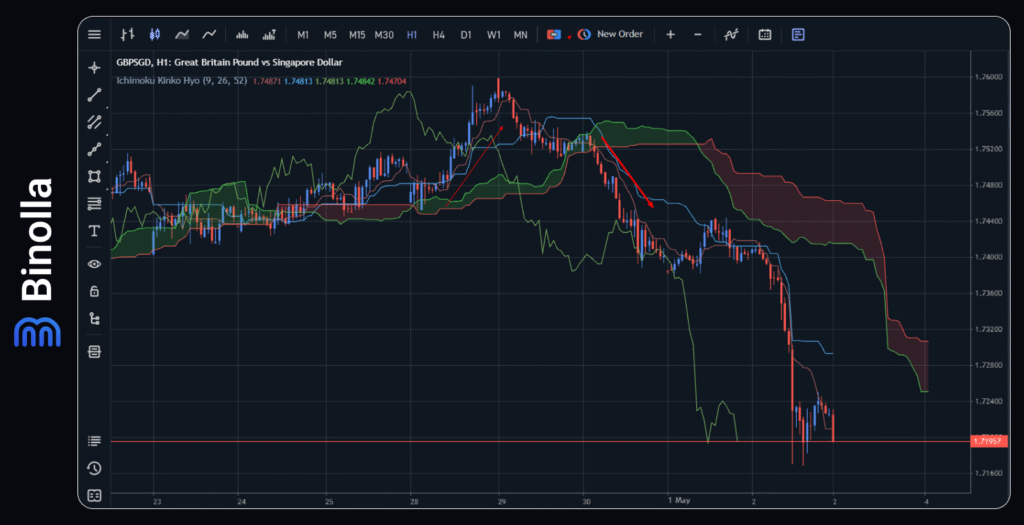
Traders can use one of the classic Japanese indicators for placing short-term trades and capitalizing on smaller price movements. The idea is very simple. You can buy or sell when the price leaves the Ichimoku cloud, depending on the direction. For instance, if the price moves above the Ichimoku cloud, you can buy, while if it breaks the lower line, you can sell. What is important here is that you don’t need to wait for any confirmation. The momentum that comes at the moment when the price leaves the cloud is very important. You should be in time to place a trade.
The same is relevant for digital options. You can purchase a Lower contract when the price breaks the Ichimoku cloud from above. To buy a Higher contract, you need to wait until the price moves above the higher line of the Ichimoku cloud.
George Summers, Top Binolla Trader
I love Ichimoku for providing a lot of signals. When I trade as a scalper, I always use the strategy when the price leaves the Ichimoku cloud, as this alert means that the market sentiment shifts. Such changes are always followed by higher volumes, which means that the price movement will be larger and the volatility will be higher.
8: Triple Exponential Average
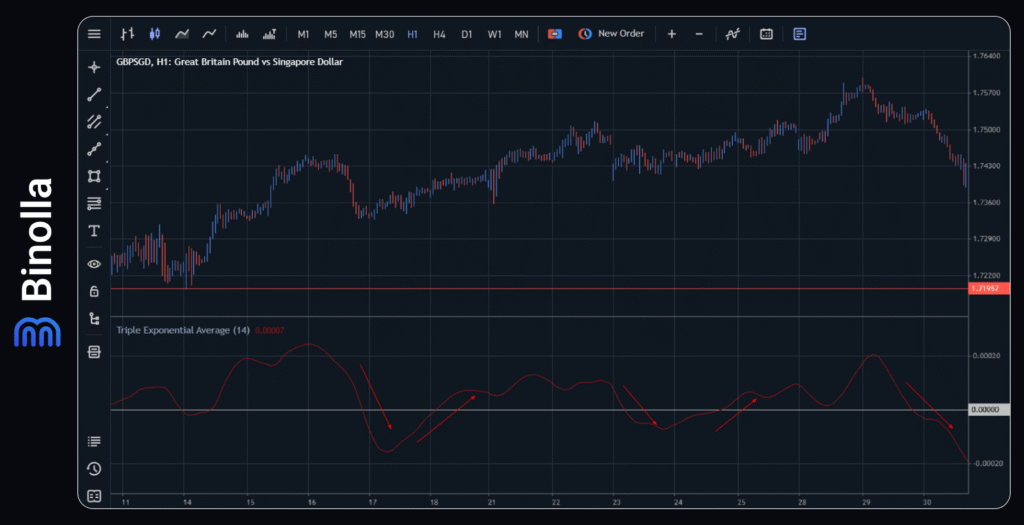
An example of trading with the Triple Exponential Average
This special indicator, based on an exponential moving average, is among the best for scalping. The indicator is located below the price chart. The line fluctuates above and below 0. When it is above 0, the market sentiment is bullish, while readings below 0 mean bearish sentiment.
The signal comes when the line crosses 0. You can sell or buy a Lower contract when the line breaks below the 0 line, while you can buy or purchase a Higher contract when the line moves above this level.
Pros and Cons of Scalping
Before placing your first trade in scalping, you should know all the advantages and drawbacks of this style. The pros of scalping include:
- Trend does not matter. When trading scalping strategies, you don’t need to pay attention to the current trend, as your main goal is to find the momentum.
- A lot of trading strategies. Traders can use various strategies to capitalize on minor price movements. The most popular ones are those where you catch breakouts.
- Quick results. You don’t need to wait for hours, days, weeks, and months to see the results, as most trades are closed within seconds and minutes.
- Scalping can be used by traders with small capital. You don’t need to invest a lot of money to use scalping strategies. Even a $100 deposit is enough to start.
When it comes to drawbacks, they include:
- Scalping is time-consuming. You need to stay at the PC, laptop, or mobile device all the time. Even if you decide to use any automated system, you still need to monitor it.
- Scalping is stressful. You will have to open a lot of trades within a day, which may be exhausting.
- Limited work with various assets. Scalpers often choose one or two assets for trading as they don’t have enough time to check a broader range of instruments.
- Smaller profits. The main idea behind scalping is to capitalize on smaller price movements. Therefore, your gains will be minor. However, at the end of the day, you may have significant profits if you stick to a profitable strategy;
- Spreads and commissions may prevent you from making money. In times of larger spreads, your profits can be significantly lower;
- Market noise. You should be prepared that the market noise on smaller timeframes will be higher. Therefore, not all your trades will be successful.
Conclusion
Scalping is a high-risk trading style that requires skills and patience. When using the best indicators for scalping, you can significantly improve your chances. We have reviewed the top 8 technical analysis tools in this article that will help you build reliable strategies. However, before starting to use these strategies, you should be emotionally prepared, as scalping is exhausting. Anyway, scalping can be very profitable as you can generate substantial profits within a day. By making about 10 pips in one trade and opening 10 trades, you can generate 100 pips in total.
FAQ

What is the Best Indicator for Scalping?
All indicators that can be used for scalping can be considered the best when you apply them correctly. Whether you use RSI, Bollinger Bands, MACD, or others, you should know how to use their signals in order to succeed.
What is the Best Scalping Signal?
The best signal for scalping is the breakout one, as the price begins to move quickly in one direction, which allows you to close a trade almost instantly.
Which Chart is Best for Scalping?
Professional scalpers often use second and minute timeframes to analyze markets and place trades.
What is the Best Spread for Scalping?
The best spread for scalping starts from 0 pips. Therefore, it is better to choose accounts with floating spreads and trade on lower volatility, avoiding periods of important data releases.
