Top 7 Digital Options Indicators You Should Know For Success Trading

Plenty of technical indicators are available for traders nowadays. They are used by market participants to find entry points when trading digital options and open trades/define targets and mitigate risks by those who trade Forex CFDs. With this huge variety of tools, you may be confused about choosing the right one. This article brings together the top 7 technical indicators that cater to all types of traders.
Create an account at Binolla and build your way to success with top technical indicators available on the Binolla platform!
Contents
- 1 1: The Moving Average Trend-Following Technical Indicator
- 2 Moving Average Strategies
- 3 2: Ichimoku Cloud
- 4 How to Use the Ichimoku Indicator in Trading
- 5 3: Parabolic SAR
- 6 How to Trade with the Parabolic SAR Indicator
- 7 4: Bollinger Bands
- 8 How to Trade Using the Bollinger Bands Indicator
- 9 Practice trading with Bollinger Bands!
- 10 5: The MACD Indicator
- 11 Trading with the MACD Indicator
- 12 6: Stochastic
- 13 FAQ
1: The Moving Average Trend-Following Technical Indicator

Moving average is a classic technical indicator that calculates the average price of a currency pair or other asset over a certain period. This useful tool collects new data and removes old data to reflect current market conditions. For example, a 50-day moving average is calculated based on the average price of a currency pair over the last 50 days.
The most trendy moving averages include:
- Simple moving average (SMA);
- Exponential moving average (EMA);
- Weighted Moving Average (WMA);
The choice of moving average type depends on the trader’s style and preferences.
Moving Average Strategies
To make the most of it, traders can use some strategies. There are plenty of trading systems with moving averages and we are going to describe here some of the most popular ones.
The Moving Average Crossover Strategy

This first strategy is very popular among traders as it is very simple and straightforward. You need to add two simple moving averages to the chart first (SMA10 and SMA20). Once a crossover occurs, you can buy a Higher or a Lower contract. In this particular example, we have a moving average crossover right in the middle of the screen. As it occurs above the price, you can buy a Lower contract or sell an asset. If the crossover occurs below the price, a trader can buy a higher contract.

This strategy is based on the concept of a breakout. The price should break the moving average first and then a trader opens a trade when the price retests the MA. Traders can engage at this very moment. In the example above, the price breaks the moving average from above and then retests it with the shooting star candlestick pattern. Once this candlestick closes, you can buy a Lower contract or sell an asset.
2: Ichimoku Cloud

Ichimoku is not an indicator, but a trading system. Ichimoku Kinko Hyo is one of the most effective trading systems for use with Japanese candlestick patterns. Ichimoku Cloud is a technical analysis tool that is widely used in forex trading. This indicator was developed by Japanese trader Goichi Hosuda in the 1930s.
The Ichimoku Cloud is a complex system consisting of five different lines that provide traders with a complete view of the trend, support, resistance levels, and potential entry and exit points.
It consists of the following components:
- Tenkan Sen. A moving average with a period of nine serves as the line to pinpoint the current market trend. If it goes up, the uptrend is developing, while when the line goes down, the downtrend occurs;
- Kijun Sen. A 26-period MA serves to define market trends. Unlike the previous one, this line boasts a longer period eliminating the market noise;
- Chikou. This line has a 26-period delay and allows market participants to see the market situation 26 candlesticks ago.
How to Use the Ichimoku Indicator in Trading

Let’s look at a simple strategy that most traders use when they add the Ichimoku Indicator to charts. The idea is to wait until the price leaves the cloud. If the price breaks the upper line of the cloud (blue line), a trader can buy a Higher contract. In the case when the price breaks the lower line of Kumo Cloud (the turquoise one), a market participant can buy a Lower contract.
3: Parabolic SAR

The indicator was designed to analyze trend markets and, although the mechanism of its calculation is similar to the moving average, the Parabolic SAR line moves with greater acceleration and visually changes its position relative to the price.
The Parabolic SAR indicator moves in the direction of a strong trend, even if the price performs current pullbacks – the main thing is that the reverse movement does not exceed some limit value. The magnitude of the shift points depends on the volatility of the price movement.
In an uptrend, the indicator points are located below the price line and follow the price from bottom to top, while in a downtrend they move from top to bottom above the price line. When the price crosses the Parabolic SAR line, a gap is formed on it and its subsequent points move on the other side of the price. The beginning of such a reversal will be the max/min price for the previous period. The break of the line means a change of direction – either a reversal or a flat (correction).
Parabolic SAR indicator can be used for placing and closing trades in addition to finding trends. It is not recommended to use other trend indicators in trading strategies with Parabolic. It should be combined with a trend strength indicator or an oscillator, for example, the Parabolic system with the ADX indicator gives stable results. ADX will assess whether there will be a really strong movement after the reversal or still a flat period.
How to Trade with the Parabolic SAR Indicator
The parabolic SAR indicator is not used solely when it comes to trading strategies. However, it can be a useful tool for digital options and FX traders to confirm entry points and find where to leave the market.

In this particular strategy, a trader buys a Higher contract when the RSI indicator leaves the oversold area (the line breaks the 30 level down top). If this happens, you should also check the position of the Parabolic SAR indicator. The dots should be below the price.
When the RSI indicator goes above 70 and then moves downwards and breaks 70 from above, you can prepare to open a trade. Check the position of the Parabolic SAR dots first. If they are above the price, you can buy a Lower contract.
4: Bollinger Bands

The Bollinger Bands indicator is one of the most trendy and widely applied technical analysis tools. It shows the volatility of the market for a certain period, which John Bollinger created in the 1980s. This indicator consists of three lines:
- Middle line;
- Upper band;
- Lower band.
How to Trade Using the Bollinger Bands Indicator

The easiest way to trade with Bollinger Bands is to wait until the price hits one of the outer bands and open a trade in the opposite direction. For instance, if the price reaches the upper band of the indicator, you can buy a Lower contract. Should the price reach the lower band, traders buy a Higher contract.

Practice trading with Bollinger Bands!
Join Binolla now and put your knowledge into action with a reliable digital options platform
Create an account5: The MACD Indicator

MACD (Moving Average Convergence Divergence) is a technical oscillator that measures the difference between two exponential moving averages (EMAs) of different periods and consists of the following components:
- MACD line;
- Signal line;
- Histogram;
Below we give a brief description of each component.
MACD line. The MACD line represents the difference between two exponential moving averages (EMAs) of a currency pair. The most commonly used EMAs are the EMAs with a period of 12 and 26. This line is drawn on a separate chart below the price chart.
Signal Line. The signal line is the 9-day EMA from the MACD line. It is drawn on the same chart and is used to generate trading signals.
Histogram. The histogram is the difference between the MACD line and the signal line and is used to visualize the strength of the trend. When the histogram is above the zero line, it indicates an uptrend and when the histogram is below the zero line, it indicates a downtrend.
Trading with the MACD Indicator

Being an oscillator, MACD provides traders with reversal signals. In our example, you can see some of them. The signal comes when the lines of the MACD indicator make a crossover. If this happens before the middle line, then a trader can buy a Higher contract. When the MACD lines make the crossover above the middle line, then one can buy a Lower contract.
6: Stochastic

A stochastic oscillator is a technical momentum indicator that displays the current price position relative to the price range over a certain time.
The main idea behind the tool is to identify market patterns:
- local extrema;
- reversals of a trend movement;
- divergence and convergence;
- overbought and oversold market.
In an uptrend, the current closing price stops for some time at the level of the previous local maximums. And in a bearish trend, it stops at the level of the previous minima. With the right choice of time interval and expectation, the indicator can be used in any market.
Stochastic Indicator Strategies

The first strategy that traders can use with this indicator requires them to wait until both lines of the Stochastic indicator move above 80% (70%) and then reverse and break this line. Once this happens, a trader can buy a Lower contract as the price leaves the overbought area.
If both lines of the indicator leave the oversold area (below 20% or 30%), a trader can buy a Higher contract.

Another strategy is when a divergence occurs. When the lows of the Stochastic indicator become higher, while the price’s highs are lower, then you can buy a Higher contract as a bullish divergence indicates that the downtrend is near its end and the uptrend will occur soon.
A bearish divergence occurs when the price makes new highs, while the indicator’s highs are lower. When a trader sees a divergence, they can buy a Lower contract once the price starts moving lower.
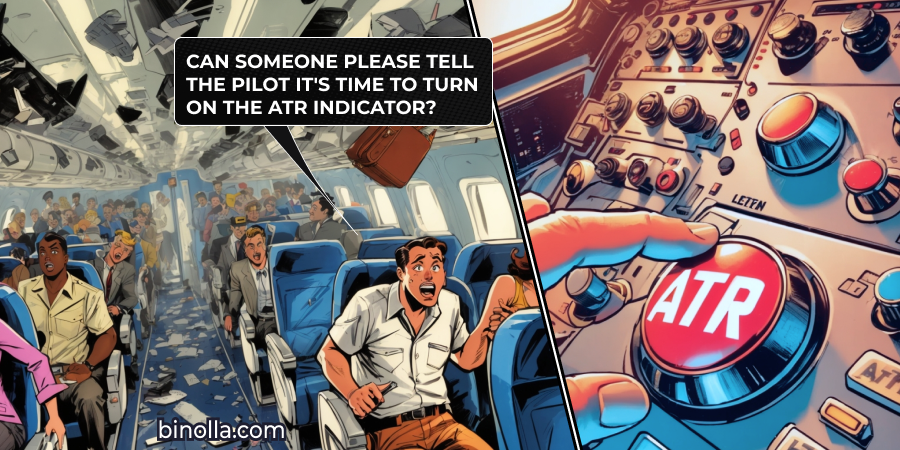
7: The Average True Range Indicator

The ATR indicator was developed by Welles Wilder, who created many technical analysis tools that are now considered classic. Its calculation algorithm and application methodology were published in 1978 in the book “New Concepts of Technical Trading Systems”.
Since the tool is a volatility indicator, ATR reflects only one indicator – price activity for a given period. The line can be used to judge only the volatility of the asset. This means that the indicator data shows the possible range of price movements in the current period of the price chart.
The ATR indicator does not show:
- Trend direction. Although sometimes the direction of its line coincides with the direction of price chart movement, it is impossible to judge the prevailing trend in the market by it.
- Trend strength. It often happens that the trend continues to develop, and the indicator line has already passed the maximum and is declining.
- Overbought and oversold areas. The indicator is calculated in absolute, not relative units, so, although it is referred to oscillator, it does not form overbought and oversold areas. Nor can it form them for another reason – it does not reflect the direction of price movement.
How to Use the ATR Indicator

As it was already mentioned, the single purpose of this indicator is to measure the volatility. Therefore, you can use it in some more complex systems as an indicator separating sideways from trend movements.
When the ATR indicator is close to its lower readings, then you can expect calm markets without a clear direction, while when it goes up, the trend is likely to begin. Keep in mind that the direction of the line has nothing to do with the trend direction.
FAQ

Which Technical Indicator is the Best?
There is no best technical indicator offering traders 100% guaranteed trading signals. All indicators that you can find in this article are good and you can use any of them to empower your strategy.
How to Choose an Indicator for Trading?
There are plenty of indicators nowadays and to choose the one, you need to read more about it to understand how it works as well as to reveal all its pros and cons. Once you have chosen one, you can test its signals in the demo mode.
Can I Use the ATR Indicator Solely without Other Technical Analysis Tools?
This tool is designed to tell traders about the current market volatility. It can tell you about whether the market is trending or not. However, the indicator does not provide signals about the trend direction or possible reversals.
Which Indicators Can Be Used for Scalping?
The best indicators for scalping are those designed to identify market momentum. They allow traders to find exact reversal points in advance. By using them, you can trade short-term contracts, including 5s Scalping.