Top 6 Bollinger Bands Strategies for Digital Options and Forex Trading

The Bollinger Bands is among the most popular trading indicators so far allowing Forex and digital options traders to find trends, watch current market volatility, and even identify entry and exit points. There are plenty of strategies that you can use when applying this indicator to your trading sessions. We have brought together the top six most popular trading systems that cater to both beginner and skilled traders. By reading this article, you will find their descriptions as well as some insightful examples.
Have a trading strategy already? Then register at Binolla and trade for real money!
Contents
- 1 What is the Bollinger Bands Indicator?
- 2 1: A Simple Bollinger Bands Reversal Strategy
- 3 2: A Reversal Bollinger Bands Strategy with Price Action
- 4 3: Bollinger Bands Trend Continuation Strategy
- 5 Try out these strategies now!
- 6 4: Bollinger Bands Breakout Strategy
- 7 5: Bollinger Bands + RSI Trading Strategy
- 8 A Strategy with Bollinger Bands and the Double Bottom Pattern
- 9 FAQ
- 9.1 What is the simplest strategy with Bollinger Bands?
- 9.2 How to use Bollinger Bands breakouts in a strategy?
- 9.3 What is a Bollinger Band Narrowing Strategy?
- 9.4 How to combine Bollinger Bands with other indicators?
- 9.5 Can Bollinger Bands be used for trend trading?
- 9.6 How do I manage risk when using Bollinger Bands?
What is the Bollinger Bands Indicator?
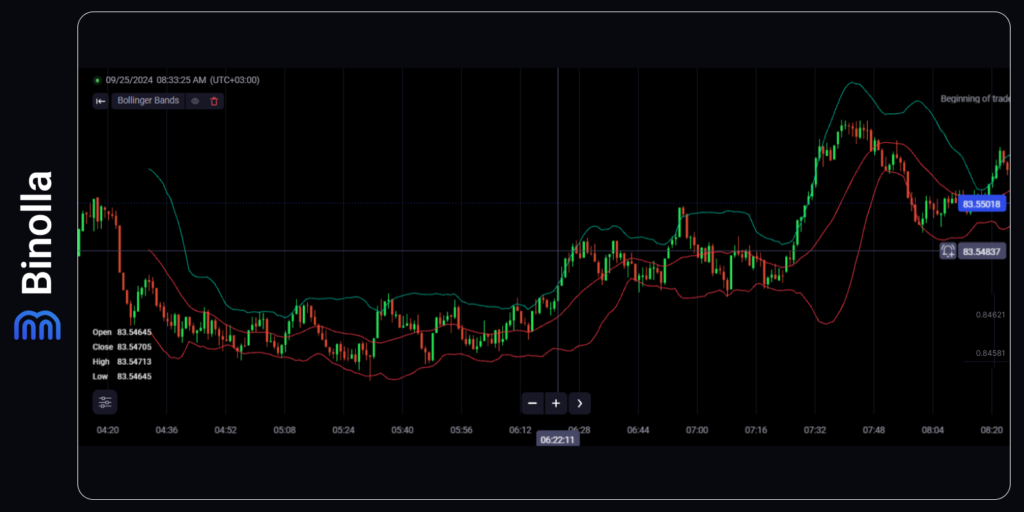
Bollinger Bands (Bollinger Lines, Bollinger Bands) is a trading indicator that measures market volatility and provides a wealth of information useful in making decisions about buying and selling financial assets.
Bollinger Bands help to determine:
- Trend continuation or reversal;
- Periods of market consolidation;
- Zones that can be broken when the market volatility increases;
- Possible highs or lows;
- Potential target levels (closing prices).
The Bollinger Bands indicator uses a statistical measure known as the standard deviation to identify areas where support or resistance levels may occur.
Bollinger Bands are displayed on a chart along price candles as an upper and lower line around a moving average. The indicator forms what is known as a volatility channel. These lines, also called Bollinger Bands, widen or narrow depending on the volatility or lack of volatility in the market in question.
Now that you know the basics of the Bollinger Bands indicator, it is time to delve into the most popular and profitable strategies.
1: A Simple Bollinger Bands Reversal Strategy
While Bollinger Bands belongs to trend indicators, it can show you points where the price can reverse. One of the most popular strategies when using this technical analysis tool is to trade when such moments occur. The easiest system is based on the price rejecting its bands.
The idea behind this method is very simple. You need to wait until the price reaches the upper or lower band of the indicator and then, once a reversal occurs, you need to buy an appropriate contract or buy/sell a currency pair, stock, cryptocurrency, or any other asset you trade.
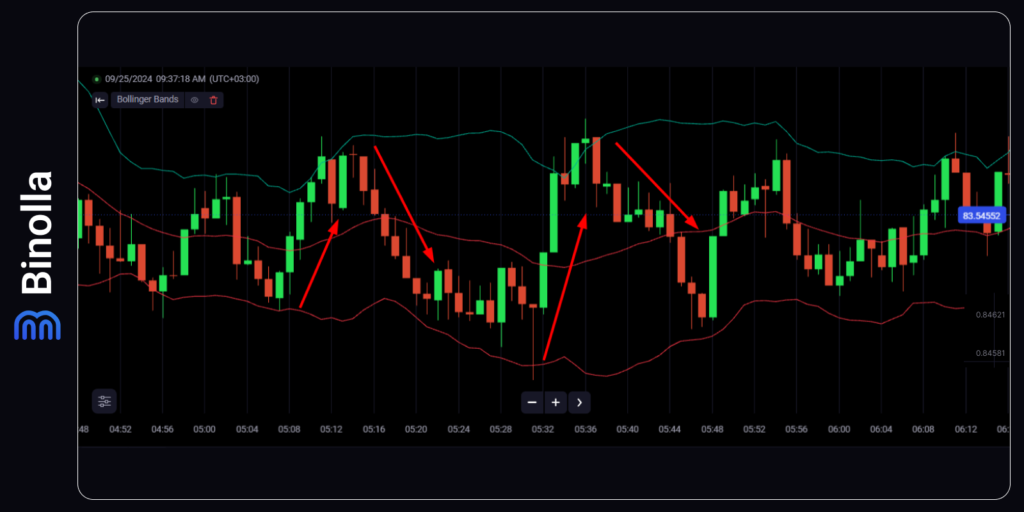
In the example above, you can see several reversals that occur on the chart that you can use to trade an asset. Once the price reverses from the lower band, you can buy a Higher contract or buy an asset, while in the opposite situation, you can buy a Lower contract or sell an asset.
Remember that Forex traders can also use Bollinger Bands to find exit points and control their risks. To close a trade, you can simply wait until the price reaches the opposite band. To prevent you from excessive risks, you can place a stop loss below the band at which you place a trade.
2: A Reversal Bollinger Bands Strategy with Price Action
Finding reversals with Bollinger Bands is a great strategy, but you can even augment it by adding price action or Japanese candlestick analysis. This will allow you to filter signals and increase your strategy profitability. However, before you can start using it, you should delve into price action and learn at least a couple of patterns.
The Japanese candlestick analysis system boasts dozens of various patterns that you can use to confirm a reversal signal when trading with Bollinger Bands. Keep in mind that the indicator acts as a dynamic support or resistance level in this case.
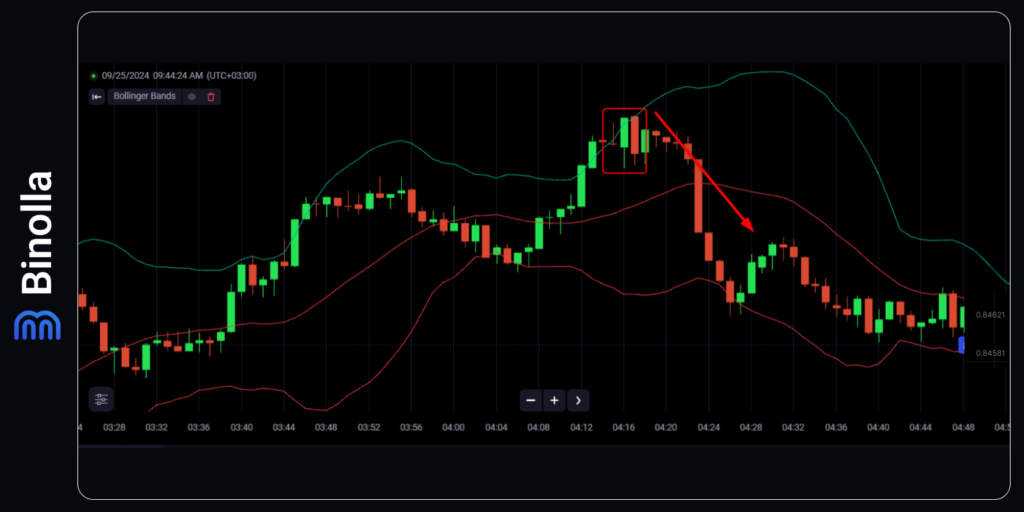
To use this strategy, you need to wait until the price reaches one of the bands. In our example, the currency pair hits the upper band. What is important here is that we have a couple of price action setups here. First comes a shooting star pattern, which is a reversal signal, and then comes bearish engulfing. As you can see, once these patterns start to work, the price moves down.
Similar to the previous strategy, digital options traders can buy a Lower contract in this case. When it comes to FX traders, they can sell the asset. Moreover, Forex traders can also use the upper band to place stop losses above it, while the lower band of the Bollinger Bands indicator acts as a target.
3: Bollinger Bands Trend Continuation Strategy
Apart from reversals, traders can use Bollinger Bands to find trend-continuation signals. One of the easiest ways to do it is to interact with the middle moving average. The idea behind this approach is to watch for the price to break above or below the middle line of the indicator. Once it happens, you can open a trade according to the direction of the price movement.
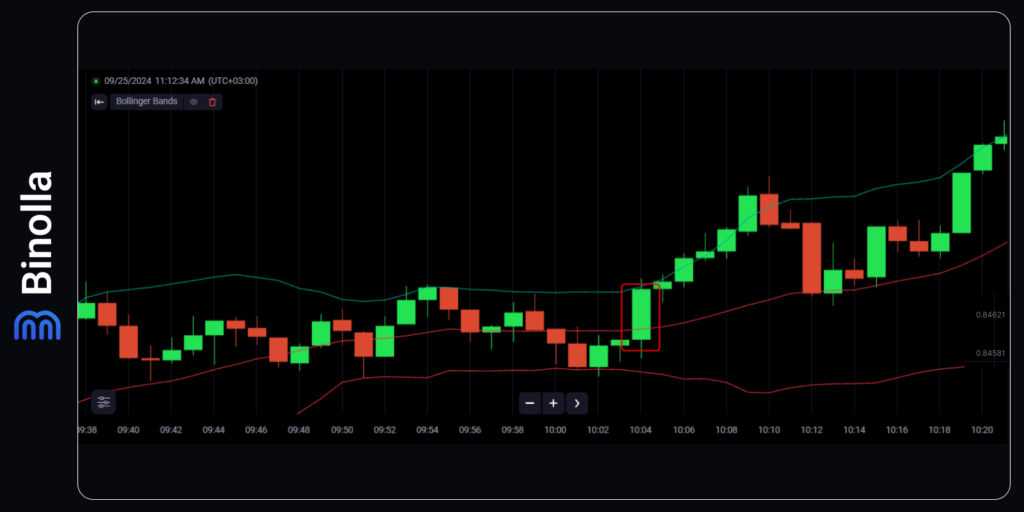
To start using this strategy, you need to wait for the moment when the price breaks above or below the middle line as it was already mentioned. In this particular example, the price breaks the middle line from below and moves higher. Once a breakout takes place, you can buy a Higher contract or buy an asset.
Digital options traders can wait until expiration after the contract is purchased. Forex traders can use the reversal signal at the upper band to set a take-profit order. When it comes to stop losses, they can be placed below the middle line.
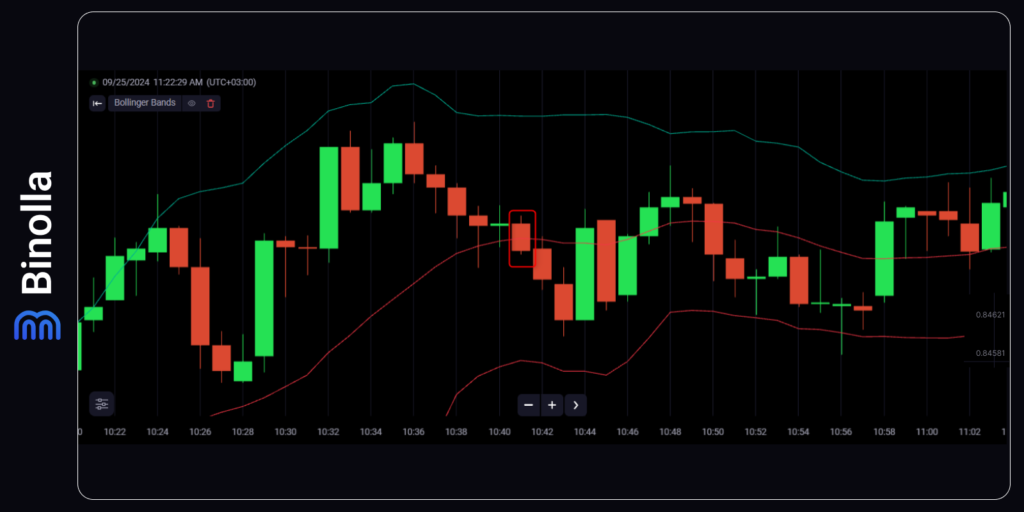
Another example shows you how to use this strategy when the price breaks the middle line of the Bollinger Bands indicator from above. The strategy is the same, but this time you buy a Lower contract or sell an asset once a breakout occurs.
As you can see, the price continues to move downwards. Forex traders can use the middle line to set stop losses above it, when it comes to targets, a reversal at the bottom line of the Bollinger Bands indicator will be a good signal to close a trade.
4: Bollinger Bands Breakout Strategy
Breakouts are among the strongest signals in trading that allow market participants to capitalize on strong momentum and directional price movements. When using the Bolinger Bands indicator, traders can also use breakout strategies.
As you know, the price is canalized within the indicator most of the time. However, at some moments, it breaks outside the bands and stays there for a while before returning to the dynamic channel. This breakout strategy uses this feature to allow you to find reliable entry points.
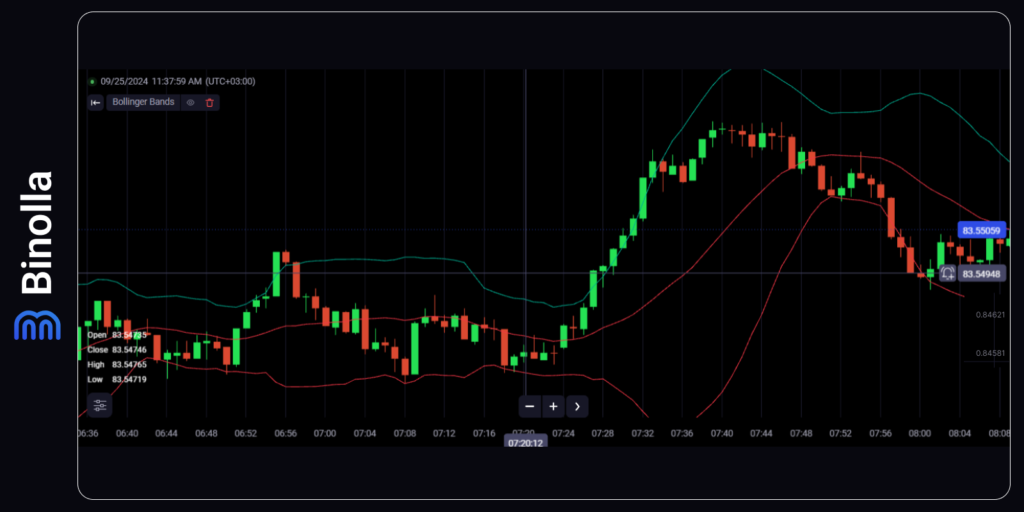
In the example above, we can see that the break breaks the upper band of the Bollinger Bands indicator from below and moves even higher. This is a great opportunity for digital options traders to buy a Higher contract. Forex traders can buy a currency pair, a stock, or a cryptocurrency at this moment. A position can be opened both once the price breaks above the upper band or once the breakout candlestick closes.
The latter is better as when the candlestick closes, you can see that the breakout is confirmed, while if you decide to buy a digital option or any asset at the moment of the breakout, you can’t be sure that the candlestick will close above the Bollinger Bands’ upper band.
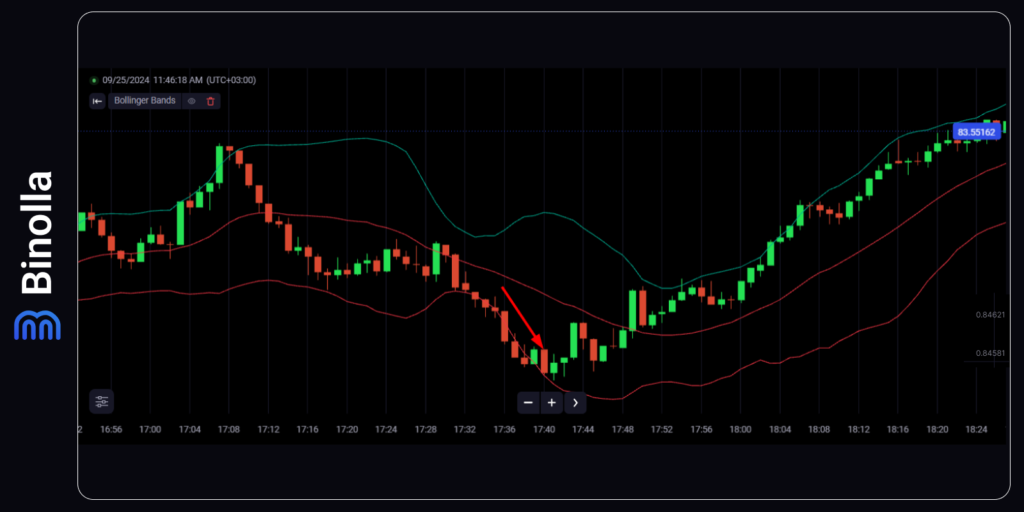
The next example demonstrates how to buy a Lower contract when using this strategy. To do that, you need to wait until the price breaks below the lower band of the indicator. Once it happens, you can engage. Similar to the previous case, you can buy a Lower contract or sell a currency pair/stock/ cryptocurrency once the breakout occurs. You can also wait for the breakout candlestick to close before opening a trade.
Which option is better? The second one is the winner as you will see that the breakout is confirmed in this case. For Forex traders, to close a trade, they can wait for the moment when the price returns inside the indicator.
5: Bollinger Bands + RSI Trading Strategy
Bollinger Bands is a reliable indicator that can be used on its own to find entry points and trade digital options and Forex CFDs. However, you can augment it with RSI to make any strategy even stronger and more effective.
When combining both indicators, you can receive clearer trading signals. However, keep in mind that their frequency will be lower. By using this method, you can find both entry and exit points.
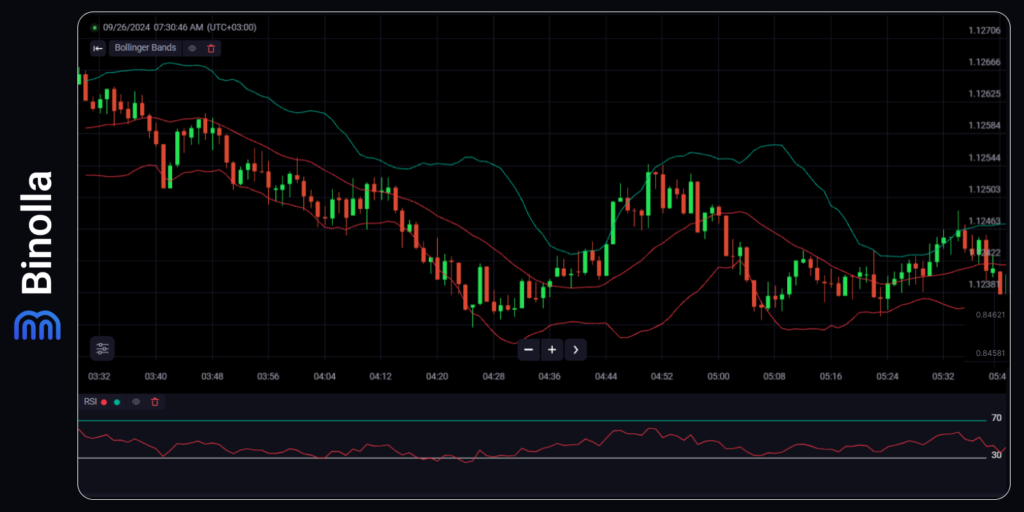
In the example above, you can see that the price tests the lower band of the Bollinger Bands indicator. At the same moment, the RSI indicator leaves the oversold, which provides you with a signal.
In this situation, you can buy a Higher contract or buy an asset once the RSI breaks the 30 level from down up.Digital options traders can wait until expiration, while FX traders can plan their profits in advance. To set a target, you can use the opposite band. To mitigate risks, you can place a stop loss right below the lower band.
A Strategy with Bollinger Bands and the Double Bottom Pattern
When trading with the Bollinger Bands indicator, traders can also use various patterns to augment their signals. Such strategies can be considered more reliable as compared to basic ones with the naked indicator. However, to start using them, you need to know how graphic patterns work first.
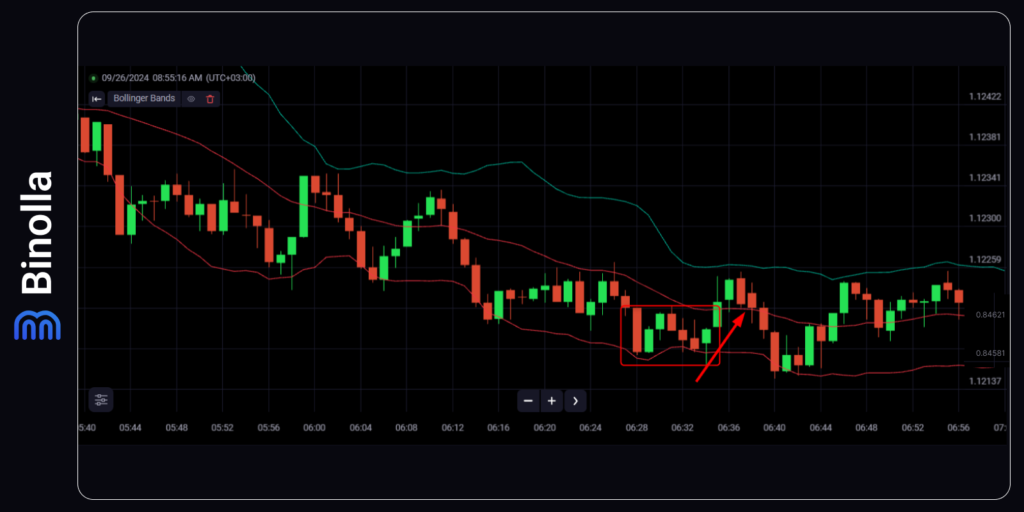
In this particular strategy, we use the double bottom pattern, which is a reversal formation. However, unlike the classic double bottom pattern, in this strategy we use the second bottom to open trades. Once the price makes the second bottom and reverses, you can buy a Higher contract or buy a currency pair/stock/cryptocurrency.
Forex traders can find targets at the opposite band. As for stop losses, they can be placed below the lower band of the Bollinger Bands indicator.
FAQ

What is the simplest strategy with Bollinger Bands?
One of the simplest strategies is to trade on a bounce from the boundaries of the bands. When the price touches the lower band, this can be a buy signal. When the price reaches the upper band, it can be a sell signal. However, it is important to confirm these signals with other indicators to avoid false entries.
How to use Bollinger Bands breakouts in a strategy?
A breakout beyond the upper or lower band can signal a strong move. In a breakout strategy, traders wait for the price to move outside the band and open trades in the direction of that movement. It is important to note that not all breakouts are sustainable, so it is important to watch for confirming signals such as volume or other trend indicators.
What is a Bollinger Band Narrowing Strategy?
A narrowing Bollinger Bands (sometimes called a “squeeze”) indicates low volatility and a potential powerful breakout. The strategy is to enter the market after the price exits the contraction. Traders usually place buy and sell orders above and below the boundaries of compression bands, waiting for a sharp move to one side.
How to combine Bollinger Bands with other indicators?
Bollinger Bands are often used in conjunction with RSI (Relative Strength Index) to confirm signals. For example, if the price is touching the lower Bollinger Band and the RSI is in oversold territory, this can reinforce a buy signal. Similarly, if the price touches the upper band and the RSI shows overbought, this can signal a possible sell signal.
Can Bollinger Bands be used for trend trading?
Yes, Bollinger Bands can help to follow the trend in trend strategies. In an uptrend, the price usually stays in the upper half of the channel, which can be a signal to hold long positions. In a downtrend, the price often moves in the lower half of the channel, indicating the advantage of short positions.
How do I manage risk when using Bollinger Bands?
One method of risk management is to set stop losses outside the Bollinger Bands. For example, when buying at the lower band, a stop loss can be set slightly below it to minimize losses if the price continues to fall. It is also useful to combine Bollinger Bands with other risk management strategies, such as risk/reward ratios, and avoid trading during times of high volatility without clear signals.
