Top 4 Effective Strategies with Moving Averages

Moving averages are a very popular technical indicator that allows traders to track price movement in both major and minor directions. Moreover, with this tool, you can create a lot of strategies that will allow you to find entry points and even provide you with information on when to leave the market. By reading this article, you will find the top five strategies with moving averages that you can apply right away. Moreover, you can start trading with the Binolla brokerage firm by creating an account.
Contents
- 1 Moving Average Strategies for Digital Options and Forex Trading
- 2 1: Triple Moving Average Strategy
- 3 2: Forex Moving Average Strategies with Stochastic
- 4 Start using these trading strategies!
- 5 3: A Simple Moving Average Breakout Strategy
- 6 4: The Best Moving Average Strategy with MACD
- 7 Advantages of Moving Averages
- 8 Conclusion
- 9 FAQ
- 9.1 What is a moving average strategy in trading?
- 9.2 What are the most common types of moving averages used in trading strategies?
- 9.3 How can a trader use a moving average crossover strategy?
- 9.4 Can moving average strategies be applied to various financial markets, or are they limited to specific asset classes?
Moving Average Strategies for Digital Options and Forex Trading
Moving average strategies are sometimes ignored by digital options traders for providing them with late signals. However, one thing that you should keep in mind is that there are no “late” signals in digital options at all. You don’t need to calculate pips when trading these contracts. Therefore, your main goal is to be able to separate profitable signals from unprofitable ones.
You can do it using standard moving average strategies, but you can also augment them with other technical analysis tools in order to receive more clear and concise signals. Remember that the only important thing when trading digital options is to see the entry point and think about expiration.
Digital options traders do not need to set their goals. They are not required to protect their in-trading risks either. Thus, when placing a trade, you should know in advance how much money to put at risk, and that’s all.
1: Triple Moving Average Strategy
The first method that we are going to share with you is known as the Triple MA strategy. To start using it, you need to apply three moving averages to the chart. If you are wondering how to do it, you can read our special guide on how to add technical indicators to Binolla charts.
We have taken simple moving averages, but you can also try others. The key idea here is to set periods so that each one has its own number of candlesticks to be taken into consideration. In our strategy, we use 5, 10, and 20 SMAs.
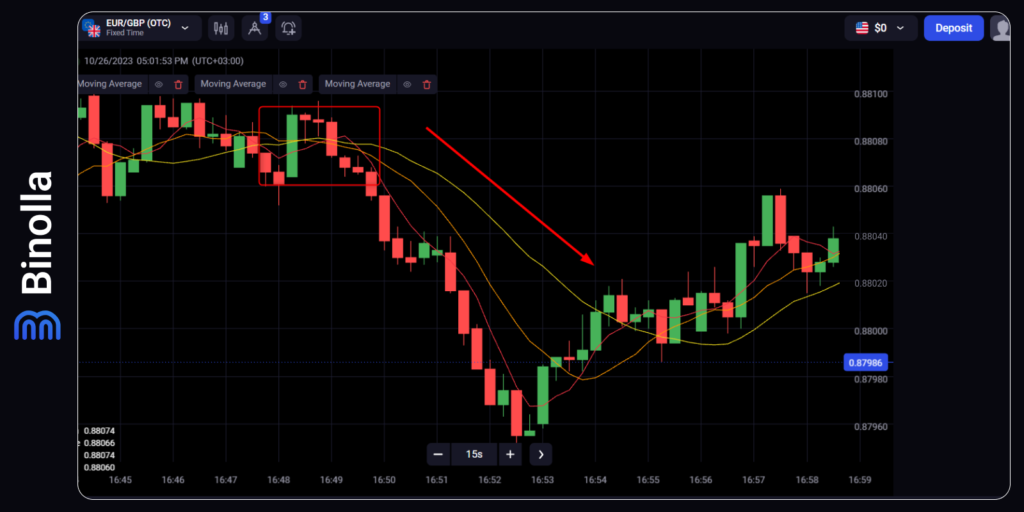
The idea behind this method is to find the moment when all SMAs are intertwined and then wait for them to choose a direction. The distance between the moving averages should extend as well. In this particular case, all three lines go downward; they move away from each other, and this is the signal to sell a currency pair or a stock. Digital options traders can buy a Lower contract in this case.
Forex and stock traders can also use this strategy to find exit points. In this particular example, you can leave the market at the moment when all lines move closer to each other and change directions. Keep in mind that digital options traders don’t need to do anything after the trade is in place, as their orders will be closed automatically after the expiration occurs.
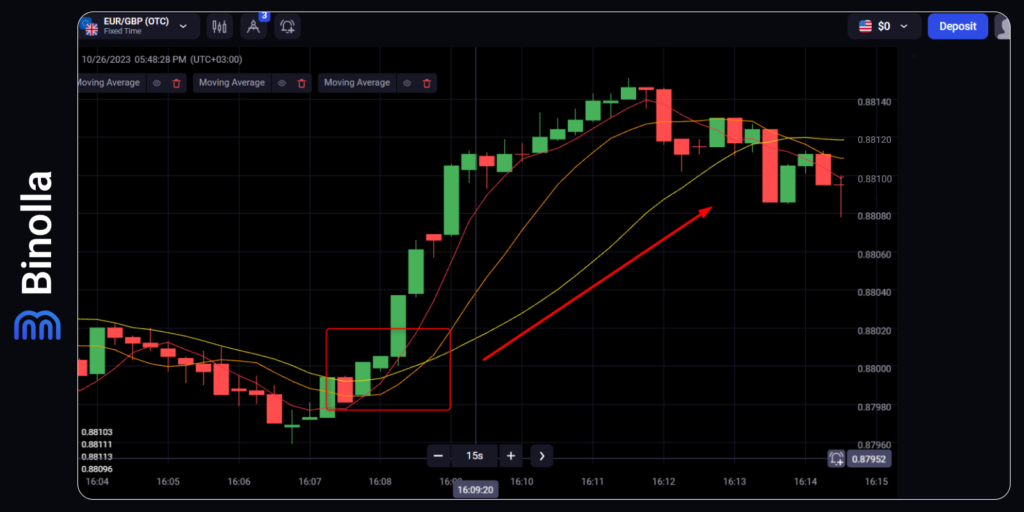
Like all other strategies, this one works both ways, allowing you to trade when the price goes downward or upward. In this particular example, we have a situation where the moving averages have the same periods as we used them in the previous one. All three lines look upward.
If you see this signal on the charts, then you can buy a currency pair or a stock. Digital options traders can buy a Higher contract in this particular situation. When it comes to leaving trades, you can wait for the lines to change their direction again and become closer to each other. For digital options traders, there is no need to take any additional steps.
2: Forex Moving Average Strategies with Stochastic
Using the moving average indicator alone may be great, but there are also a lot of combination variations that you can apply in your trading routine. For instance, you can add two moving averages with periods of 5 and 10 and blend them with the stochastic indicator.
Both serve different purposes. Moving averages help traders define trends, while stochastic is here to find out the moments of price reversals or corrections.
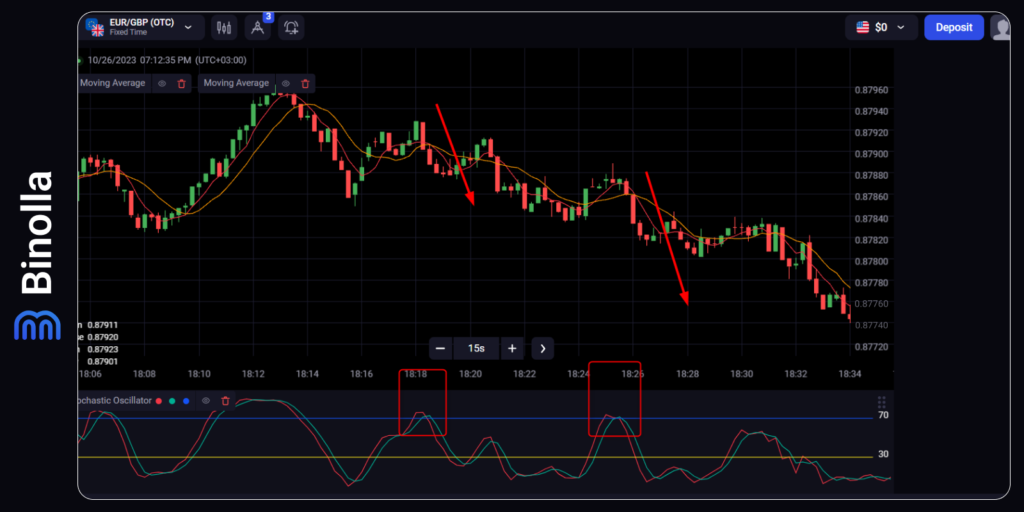
In this particular strategy, we are going to use moving averages to identify major price movements. The Stochastic indicator is here to help us find corrections. When the latter is above 70 and goes back below this line, you can expect the price to make a reversal. As you can see in the image above, these exact moments coincide with the end of a correction.
Forex and stock traders can use them to add to their current positions and sell currencies or shares. As for digital options traders, they can simply buy Lower contracts.
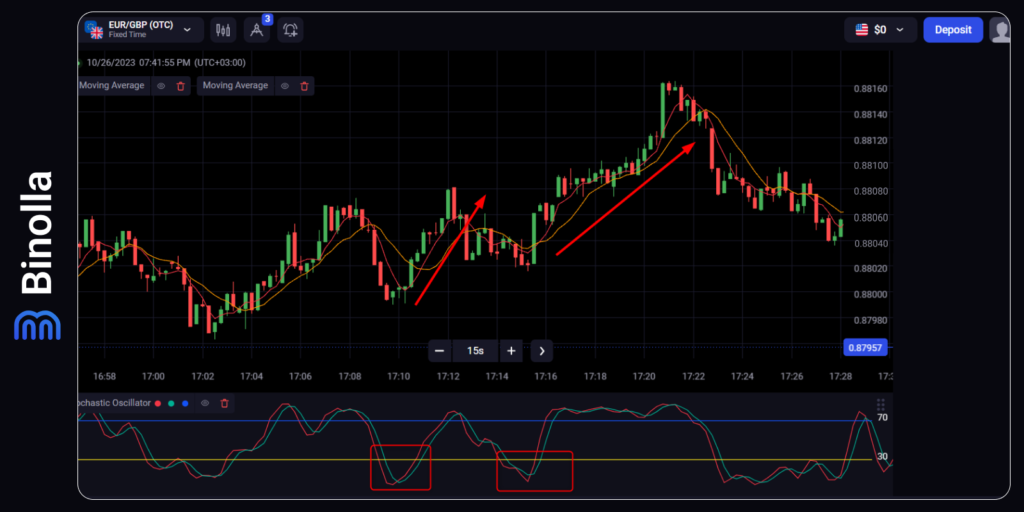
This moving average strategy works in situations where the uptrend is dominant. The image above shows the uptrend and a couple of deep corrections. The idea is to place a trade when the Stochastic indicator leaves the oversold (below 30) area. Once it happens, you can buy a currency pair or a stock. If you are trading digital options, then you can buy a Higher contract.
Forex and stock traders also need to protect their trades. Stop losses can be placed below the lowest points of both corrections at a distance that you think is enough to protect your balance from excess risks. When it comes to price targets, traders can hold their positions until both moving averages are intertwined again and start moving sideways.
3: A Simple Moving Average Breakout Strategy
Using a single moving average may be a good idea to find entry points as well. While the indicator itself is designed to outline trends, you can still apply it separately to reveal trading signals.
The strategy that we are going to describe here is based on a 200-period simple moving average. This is a very long period, which smoothes price fluctuations. It can be used to identify market trends, but it can also be useful to place trades.
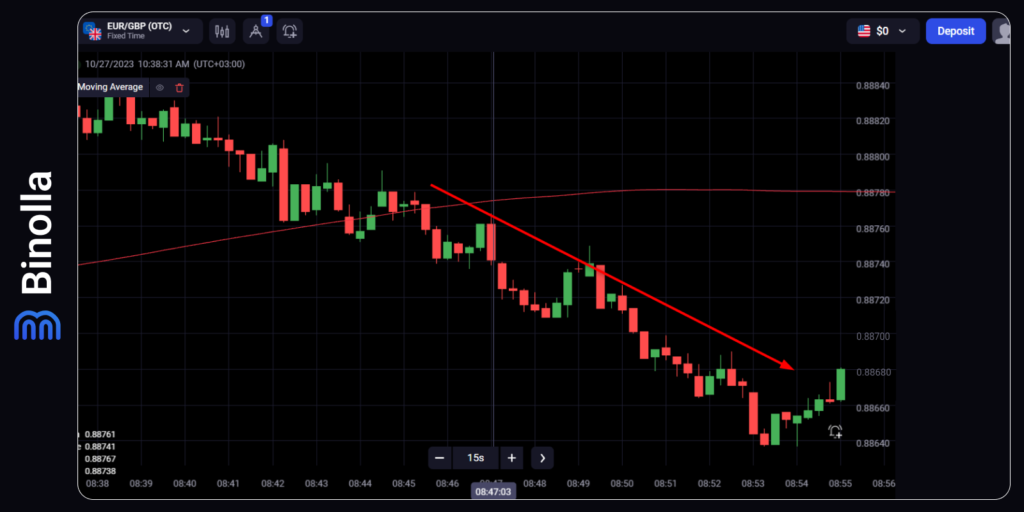
The image above shows how to trade with this indicator without adding any other technical analysis tools. First, you should understand the current trend. In this case, we have a downtrend at the left part, and the price is getting close to the moving average indicator. Once it breaks the MA line from above, you can sell a currency pair or a stock. Digital options traders, in turn, can buy a Lower contract.
To protect your trades, you can use stop losses. Place them above the 200-period moving average at a distance that allows you to properly manage your risks.
If you used to trade with support and resistance levels, you will see that this strategy is similar to that with level breakouts. When the price is above the 200MA line, the latter acts as a support level, while when the price is below it, the moving average acts as resistance.
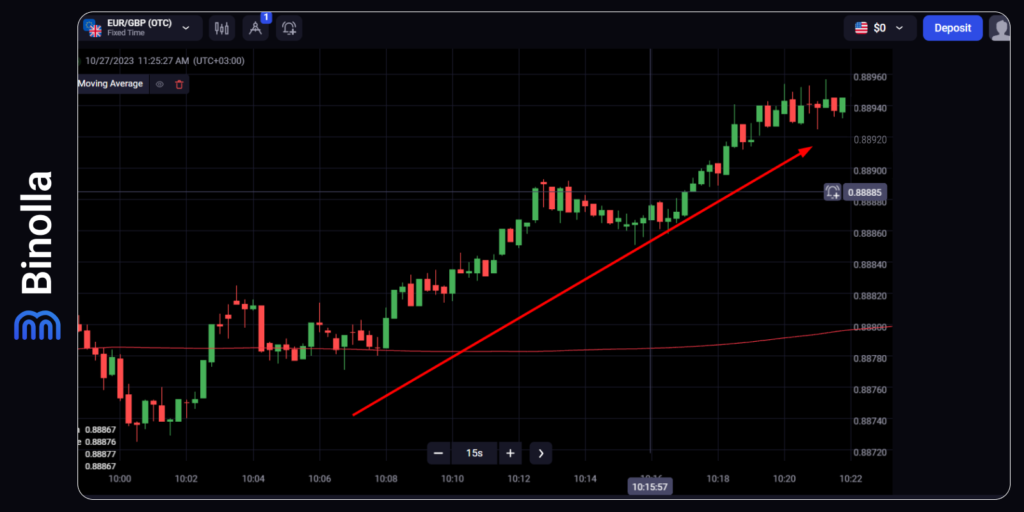
The same strategy can be applied to the uptrend. You need to wait until the price breaks the 200-MA line from below. Once it happens, you can buy a currency pair or a stock. For digital options traders, this is an opportunity to buy a Higher contract.
For stop losses, you can use the 200-MA line as a signal and place them below it. Keep in mind that if you are trading digital options, you don’t need to take any additional steps.
4: The Best Moving Average Strategy with MACD
Adding MACD can be a great idea if you want to augment any of your strategies with moving averages. Here is how you can use both indicators to increase your chances of profiting.
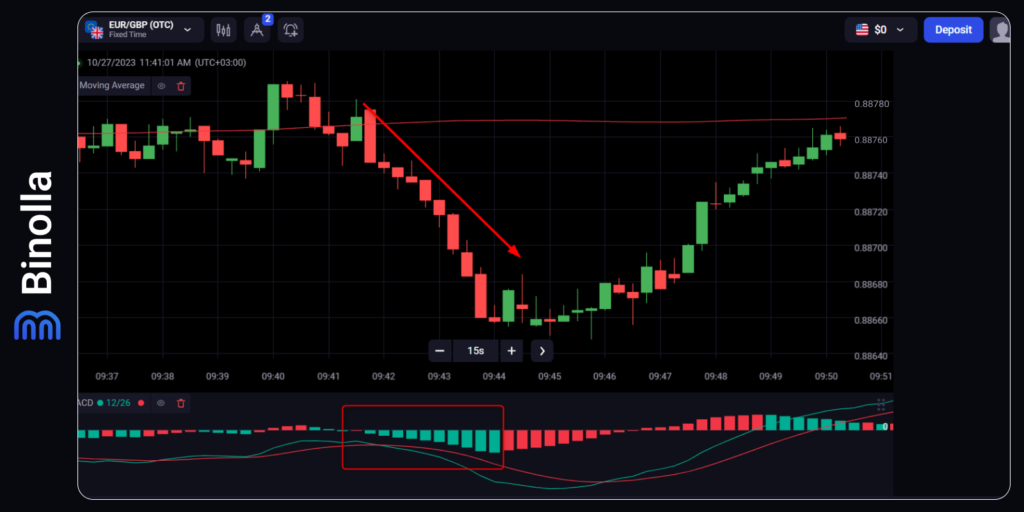
In this particular strategy, we use the same 200-period SMA. MACD has standard settings. You can see that the price breaks the moving average, and this is a signal for you to sell. However, to be more sure about whether you should take advantage of this situation or not, you can look at MACD.
When the histogram falls below 0, this is a confirmation that the price is likely to go further in the southern direction, which means that you can sell. When trading digital options, you can buy a Lower contract when you have this signal confluence.
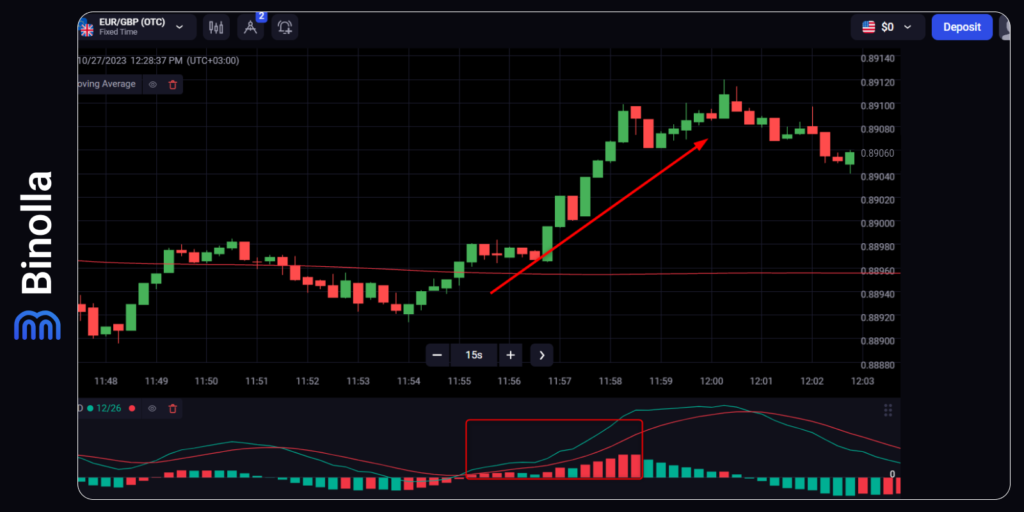
When the situation is the opposite and the price breaks the 200-period MA line from below, you can buy a currency pair or a stock. However, to make it even more evident, you can also use the MACD indicator and its histogram. The buy signal should be confirmed by the histogram jumping above 0. If it happens, you can go long with a currency pair or a stock. Digital options traders can buy a Higher contract in this case.
Advantages of Moving Averages
The moving average indicator has a lot of advantages that you will benefit from when using it. Here are some of the key pros:
- It allows you to identify market trends by simply applying it to charts;
- You can use various settings to create different trading strategies. By increasing its length, you make it show you major trends, while by decreasing it, you can watch minor corrections;
- Moving averages can be used as support and resistance levels;
- The indicator can be simply used to create an average price for a particular period. It is responsive to new information, and you don’t need to update it on your own.
When it comes to cons, they are the following:
- The first known disadvantage of this trading indicator is that it is lagging. You will receive signals about trend changes later, when the price has already reversed. Therefore, by using this technical analysis tool, you will be late for price reversals in most cases;
- The moving average indicator is good for trending markets, but it is almost useless for sideways markets. Therefore, you will have to choose another indicator if the price does not show any intent of going upwards or downwards.
Conclusion
We have provided you with four effective strategies that you can use when trading with moving averages. However, there are a lot more tactics and methods that traders apply when they deal with this technical analysis tool. You can create something on your own by learning more about the moving average indicator and its main features.
FAQ

What is a moving average strategy in trading?
A moving average strategy in trading is a popular technical analysis approach that helps traders identify trends and potential entry or exit points for assets like stocks, currencies, or commodities. It involves calculating the average price of an asset over a specified period and using this average to make trading decisions.
What are the most common types of moving averages used in trading strategies?
The two most common types of moving averages used in trading strategies are the simple moving average (SMA) and the exponential moving average (EMA). The SMA calculates the average price over a specified period equally, while the EMA gives more weight to recent prices, making it more responsive to recent market movements.
How can a trader use a moving average crossover strategy?
A moving average crossover strategy involves using two moving averages of different timeframes, typically a short-term and a long-term one. When the short-term moving average crosses above the long-term moving average, it generates a “buy” signal, indicating a potential uptrend. Conversely, when the short-term moving average crosses below the long-term moving average, it generates a “sell” signal, indicating a potential downtrend.
Can moving average strategies be applied to various financial markets, or are they limited to specific asset classes?
Moving average strategies can be applied to various financial markets, including stocks, forex, commodities, and cryptocurrencies. Their versatility makes them a widely used tool among traders and investors looking to identify trends and make informed trading decisions across different asset classes. However, it’s essential to fine-tune the specific parameters of the moving averages to suit the characteristics of the asset and market conditions.


