Three Black Crows and Three White Soldiers: How to Capitalize on Price Reversals Effectively

Japanese candlestick patterns are among the most popular technical analysis tools that allow market participants to predict trade continuation or find reversals. Apart from simply telling you about the possibility of future price movements, such models allow you to delve deeper into market sentiment and see how it changes over time. With such patterns, market participants can make informed decisions about both entries and exits. By reading this article, you will learn more about the three black crows and three white soldiers patterns and how to trade them. Moreover, we will provide you with some illustrative examples that will help you trade them effectively.
Looking for a reliable Forex broker to trade with? Join Binolla now and benefit from the best trading conditions with a trustworthy company!
Contents
- 0.1 Key Takeaways
- 0.2 Candlestick Reversal Patterns: What Are They?
- 0.3 Three Black Crows Pattern Essentials
- 0.4 See these patterns in action at Binolla!
- 0.5 Three White Soldiers Pattern
- 0.6 How to Trade with The Three White Soldiers Pattern
- 1 Tips and Recommendations for Trading Both Patterns
- 1.1 Main Mistakes to Avoid When Trading with These Patterns
- 1.2 Conclusion
- 1.3 FAQ
- 1.3.1 What is the Difference Between Three Black Crows and Three White Soldiers?
- 1.3.2 Can I Use These Patterns on All Time Frames?
- 1.3.3 Can I Rely on These Patterns Alone?
- 1.3.4 Should I Use Any Volume Indicator When Trading with These Patterns?
- 1.3.5 Can I Find These Patterns in the Middle of a Trend?
Key Takeaways
- Three black crows is a bearish pattern predicting the possibility of a downside movement or a correction.
- Three white soldiers is a bullish pattern, which tells market participants that the uptrend or the upside correction is near.
- Both patterns need volume confirmation before being traded.
- Market participants should know how to filter candlesticks within these patterns to make more informed decisions.
- Both three white soldiers and three black crows mean that market sentiment is shifting.
Candlestick Reversal Patterns: What Are They?
Candlestick reversal patterns appear on price charts and demonstrate to market participants the probability of future quotes reversals. With these formations, traders and investors can be informed in advance about the probability of changes in price direction, i.e., points where buyers are no longer in control and bears are ready to dominate or, conversely, sellers can’t push the price lower and buyers are ready to overtake them.
One of the main benefits of knowing reversal patterns is that they provide early signals of a probable reversal. Unlike many technical indicators, mostly trend ones, which are lagging, which means that they provide late signals, Japanese candlestick patterns are early reversal predictors.
One of the specifics of using these patterns is the context. While you can use a technical indicator all alone, candlestick patterns require confirmation. For instance, you can’t just look at the candlestick itself and tell that the market is going to reverse. The position of the pattern matters as well. If you see a hammer formation, then it should be at the support level to predict the upside reversal. The shooting star, conversely, should be positioned at the resistance level to tell you about the bearish reversal.
There are plenty of reversal candlestick patterns consisting of one or even two candlesticks. However, only a few of them comprise three or more bars inside. Three black crows and three white soldiers are rare, but they are still very effective once you find them. Let’s make a breakdown of each and watch how to use them in trading effectively.
Three Black Crows Pattern Essentials
The three black crows pattern is a reversal candlestick formation that appears at the top of the uptrend, when the bullish pressure exhausts. It comprises three black (or red) candlesticks going one after another, with each next closing below the previous one. The pattern tells traders that the bullish momentum is almost over, and sellers may gain control of the market.
From the market psychology perspective, the pattern is a good indicator of a strong shift in market sentiment. After the price made a significant upside movement, three black (or red) candles appear, suggesting that bulls are no longer controlling the situation. Additionally, the pattern itself, with strong bearish candlesticks, tells market participants that bears step up aggressively.
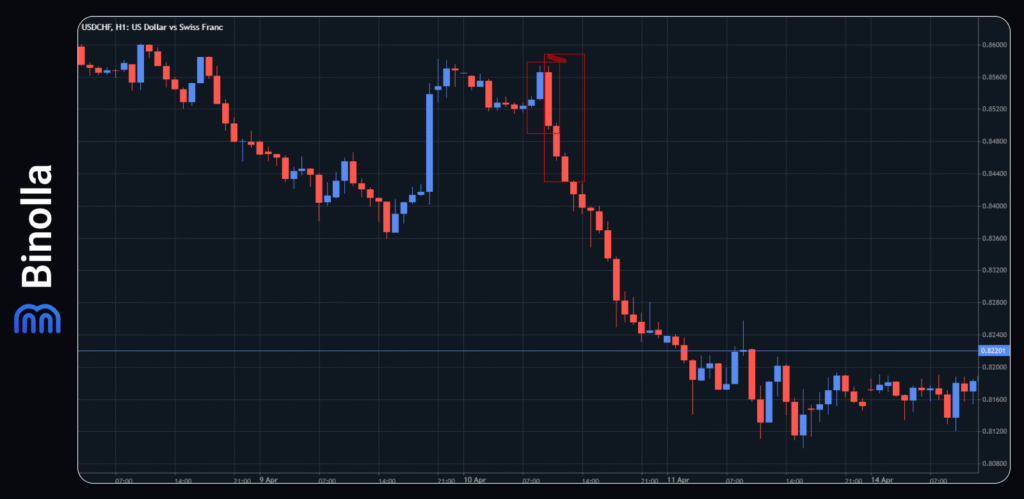
To be able to identify the pattern on charts, you should know its characteristics. Some of the most important parts of this formation include:
- The pattern should comprise three full-bodied black (or red) candlesticks with no or small lower wicks. This is important as such candlesticks tell traders that bears have serious intentions and they push the price lower and lower without even giving a chance to bulls.
- Each candle of the formation closes lower than the previous one, which confirms the downward pressure.
- The pattern should appear after the uptrend, not during the range.
- The formation of the candlestick pattern should be accompanied by rising volumes.
When it comes to trading the three black crows pattern, the rules are not complex, but you should be patient. Instead of engaging right at the top of the market, you need to wait until all three candlesticks close before placing a short trade.
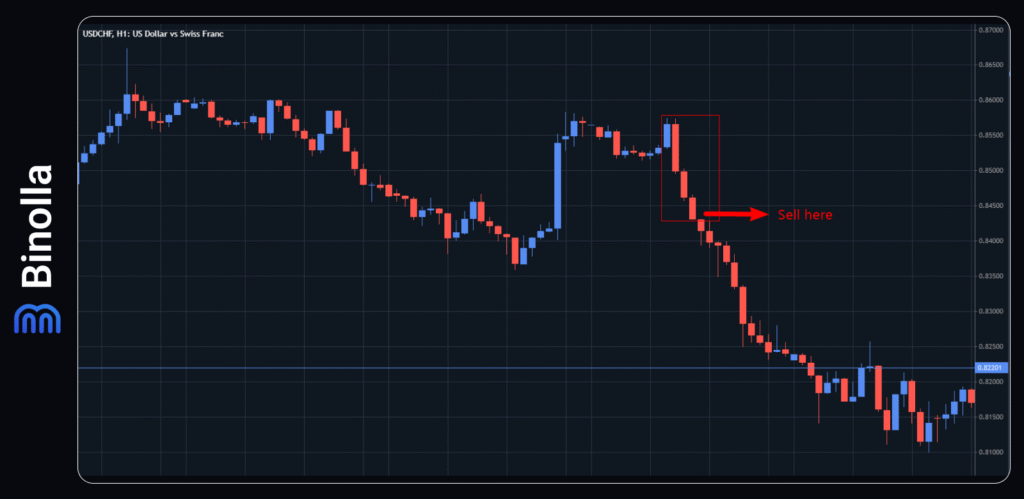
The first red candle should engulf the previous bullish one. This is the first marker of the pattern that should appear to continue monitoring the market. Then, you need to wait for the two bearish candles in a row. They should have small or even no lower wicks. The sell order can be placed once the third red candlestick closes.
When it comes to the stop loss order, it should be placed above the third red candlestick of the pattern. However, the distance between the sell order and the stop loss should not exceed your risk-per-trade level. Therefore, it is better to use the risk-to-reward approach to calculate stop losses than rely on the third candlestick in some cases.
When it comes to the length of the upcoming downtrend, there are no markers for take profit when using this pattern. Therefore, you can simply use your risk-to-reward ratio to calculate it or monitor the market to see whether any bullish reversal pattern appears to close your trade.
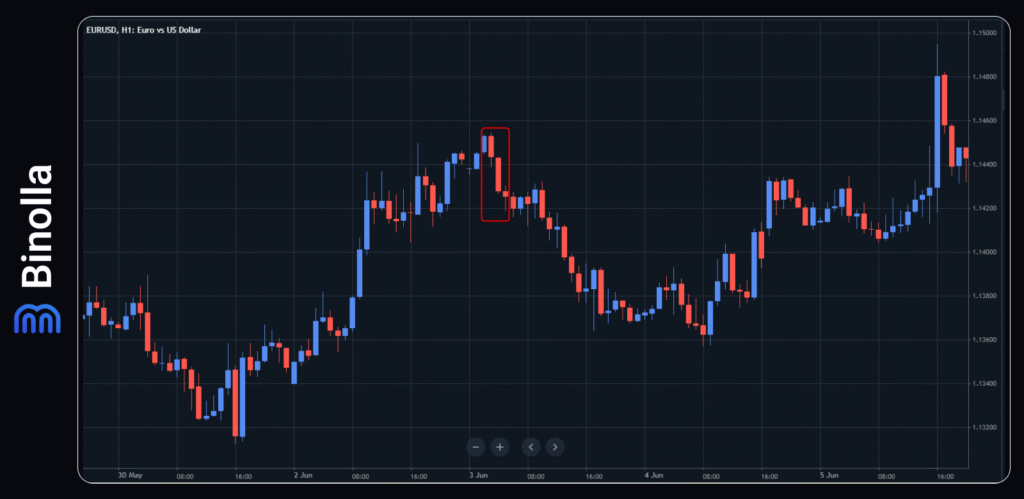
Now that you know more about this pattern, it is time to look at a bad example of this formation. In this particular case, the pattern meets almost all the necessary conditions except for the length and structure of the last candlestick.
The first red candle engulfs the bullish one, then we have the next red candle, which is long enough with almost no lower wick. However, the final candle of the pattern has a long downside tail, which means that the pattern is not complete. As you can see, the price tends to move higher after the last candle. However, in general, the downtrend resumes afterwards.
Three White Soldiers Pattern
The three white soldiers pattern is a bullish reversal candlestick that comprises three bullish candles that go in a row with small or no upper wicks. Each following candle should close near its high, showing the bullish pressure.
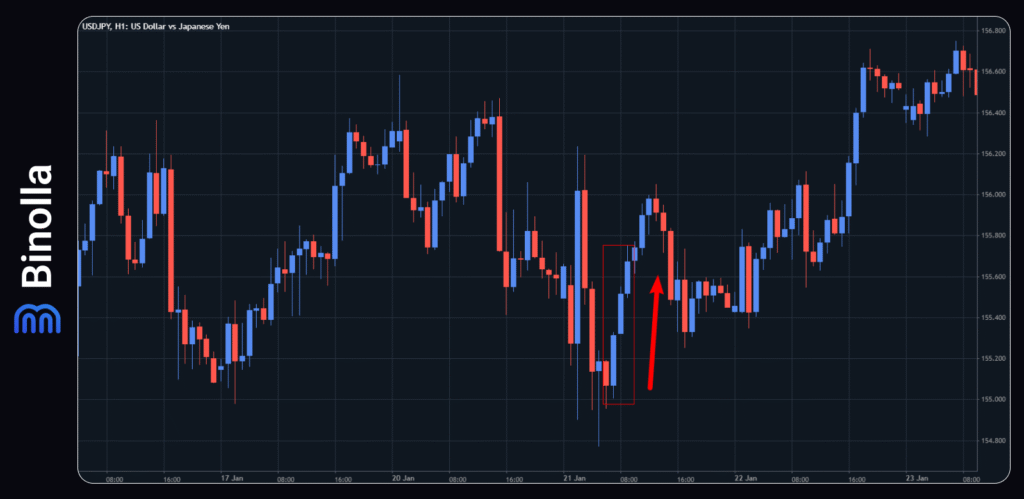
The pattern normally appears after a strong downtrend. The psychology behind it is simple. Sellers can’t progress by pushing the price lower, while bulls are taking control. The prolonged period of the downtrend is over. To be more sure about the reversal, traders wait for three consecutive bullish candles to close. The pattern indicates increasing demand and sets the foundation for the possible price reversal or at least a correction.
Before using this pattern, you should know its key features, which include:
- The pattern consists of three bullish candlesticks with long enough bodies and small upper wicks.
- The opening price of each next bullish candlestick should be within or above the closing price of the previous one.
- All three candles close near their highs.
- The pattern works better when it appears after a prolonged downtrend or in a period of selling exhaustion.
How to Trade with The Three White Soldiers Pattern
When trading three white soldiers, traders often search for confirmation. For instance, this can be a situation when the price moves above a local resistance level.
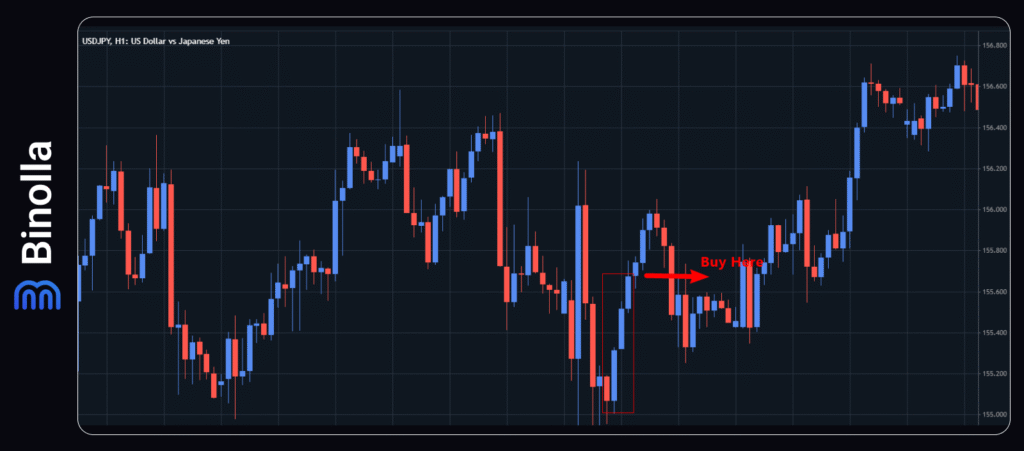
In this particular case, the third bullish candlestick closes between levels, but once it happens, you can place a long order to benefit from the upcoming upside movement. Keep in mind that the rest of the local movement is brief, which means that you won’t make much money on it.
To place a stop loss, you can look at the lowest point of the third candle. However, it will be even better to use a risk-to-reward ratio approach, which means that you should calculate how much you can put at risk to make an expected profit.
In the example above, you can increase your profits if you start trading when the bullish engulfing closes. As you can see, the first candle of the three soldiers pattern engulfs the body of the previous bearish candle. Therefore, you can buy at this point and use three while soldiers as confirmation that the trend will continue in your favor.
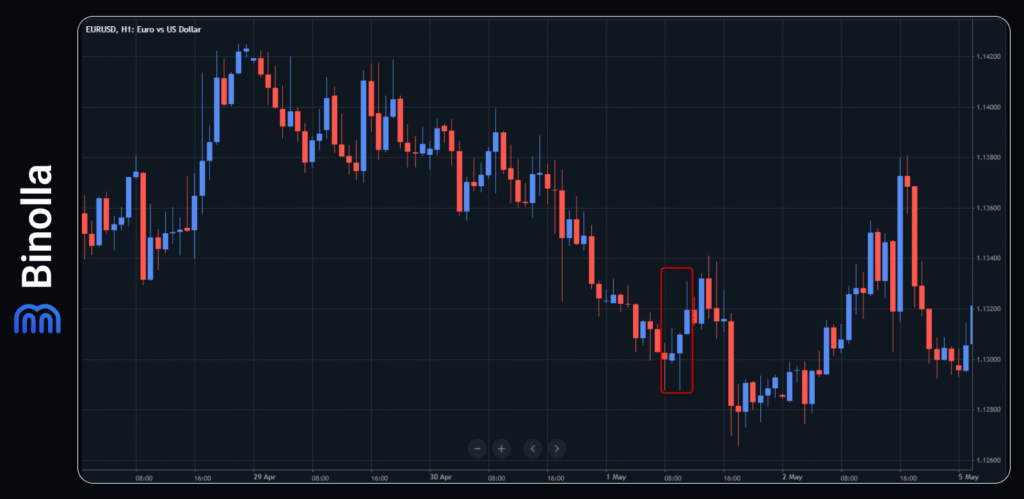
While the three white soldiers pattern is very illustrative, sometimes traders make mistakes when trying to find it on charts. This is an example of a wrong pattern, which will not work as expected. The first bullish candlestick here has a long upside tail. The last one also has a long upside wick, which means that the formation is not relevant. As you can see it later, the price makes an attempt to grow and moves downwards.
Tips and Recommendations for Trading Both Patterns
These patterns are pretty much simple, but there are some things that may improve your perception and performance. Here are some recommendations from professional traders when you find these patterns on charts:
- Check the volume. Normally, when these patterns begin to work, volumes increase. If you see that nothing changes in volumes, then it is better to skip and wait for something else.
- Watch higher timeframes for confirmation. Both patterns work better on higher timeframes like 4-hour and even daily. However, even if you notice one of them on the hourly chart, you can work with it.
- Draw key support and resistance levels. Keep in mind that three black crows appear at the resistance level, while three white soldiers form at the support level. Therefore, before even trying to seize these patterns, you should understand where the key levels are.
- Use additional indicators for confirmation. For instance, if you add a 200-period simple moving average, you can see whether the trend has changed direction after any of these patterns occur.
- Do not trade within the range markets. Range markets are narrow, and even if you see three candles of the same type, they may test the resistance or support levels and reverse again.
Main Mistakes to Avoid When Trading with These Patterns
Whether you found three white soldiers or three black crows, both are very reliable patterns. However, even a minor mistake can interfere with your plans. Here are some of the most common failures that prevent traders from making money on these patterns:
- Buying or selling various assets without a context. When trading these patterns, you should always check the main context of the market and act accordingly. For instance, when trying to capitalize on three white soldiers, you need to make sure that there was a strong downside movement previously. Also, this pattern should be located at the support level.
- Entering too early. Another common mistake is when traders buy or sell too early, before the third candle closes. Even if you are sure that nothing will happen, financial markets may bring surprises. Always wait for the third candlestick to close before entering the market.
- Using both patterns in sideways markets. As already mentioned, whether you trade three black crows or three white soldiers, you should make sure that the market is not choppy or sideways. You can use additional indicators like ADX or ATR to check the trend strength and volatility.
Conclusion
Both three black crows and three white soldiers are strong candlestick patterns, which allow you to find market reversals or deeper corrections. By using them, you can improve your trading performance. Even if they seem complex at first, once you grasp them, they will enrich your pattern library and allow you to make informed market decisions in various situations.
FAQ
What is the Difference Between Three Black Crows and Three White Soldiers?
The main difference between these patterns is that three black crows appear after a strong upside movement and predict the possibility of a downside reversal or correction. Three white soldiers, in turn, appear after a strong downside movement and tell you about the probability of a reversal or an upside correction.
Can I Use These Patterns on All Time Frames?
Yes, you can. However, you should keep in mind that the higher the time frame, the better your chances of making a profit.
Can I Rely on These Patterns Alone?
Candlestick patterns allow you to trade them without adding any technical indicators. However, you should draw support and resistance levels to be aware of the key market areas at least.
Should I Use Any Volume Indicator When Trading with These Patterns?
You can add any volume indicator to check volumes when trading three black crows or three white soldiers. This will help you confirm the pattern and make an informed market decision.
Can I Find These Patterns in the Middle of a Trend?
No, never. These patterns occur at the top or bottom of a trend. For instance, three black crows mean that buyers are exhausted, while three white soldiers indicate the end of the downtrend. None of these patterns can be found in the middle of the directional movement.
