The Hanging Man Candlestick Pattern: A Complete Trader’s Guide

Candlestick patterns may look very simple, but they become a reliable and strong tool that helps binary option traders identify future price movements. Formations like hanging man can be frequently found on charts, which makes them very popular among traders. By knowing how to apply it properly, you can significantly improve your trading results and find even more entries during your trading sessions. Read on to discover what a hanging man pattern is and how to apply it in real trading.
Contents
- 1 What is a Hanging Man?
- 2 How to Identify the Hanging Man Pattern
- 3 Start Using the Hanging man Pattern Now!
- 4 The Psychology Behind the Pattern
- 5 How to Trade the Hanging Man: A Simple Yet Powerful Strategy
- 6 Hanging Man vs. Hammer vs. Shooting Star
- 7 Common Mistakes When Trading with the Hanging Man Pattern
- 8 Volume Confirmation
- 9 Risk Management for Hanging Man Trades
- 10 Advanced Nuances of Trading with Hanging Man
- 11 Conclusion
- 12 FAQ
What is a Hanging Man?
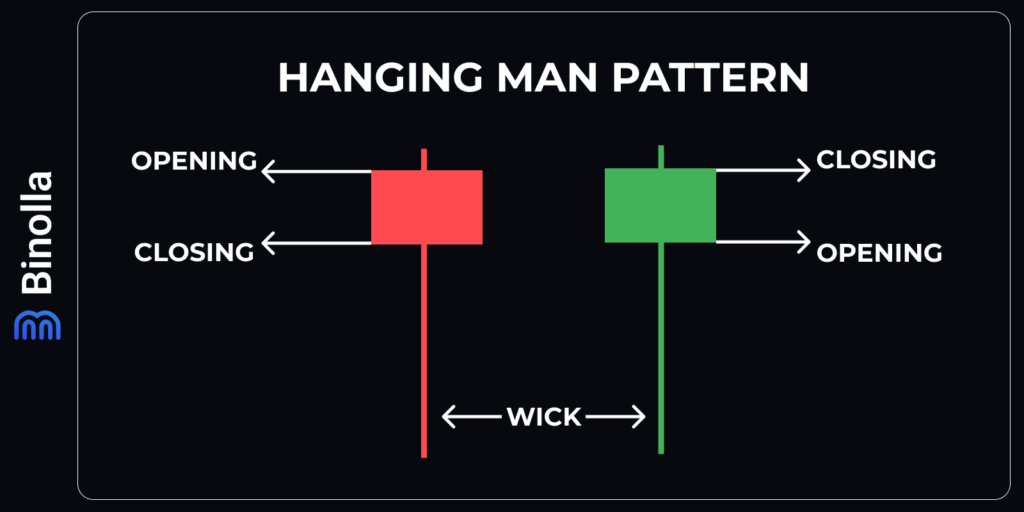
The hanging man is a bearish reversal pattern that can be found at the top of the uptrend at the resistance level. It warns traders that the upside may come to an end and a downside may begin. The logic behind the pattern is simple. During an uptrend, sellers suddenly show up and try to drive the price lower. Buyers still try to regain control, which can be seen on the chart. The body is small, but still it shows that neither side managed to beat the other.
However, the selloff itself tells traders that buyers are losing control. There are motivated sellers, ready to put the price lower. When using this pattern, traders should understand one important thing. A hanging man is not a signal itself. It is like a warning light. Therefore, acting on it without confirmation may cost you a lot.
How to Identify the Hanging Man Pattern
Not all candles with a small body at the top can be qualified as a hanging man. Here we have collected all the most important criteria that will help you differentiate the proper pattern:
- The candle should appear after an uptrend. Context is everything. The same candle during the downtrend is known as hammer and it tells traders that the downside may be over.
- Small real body. The body should be very small. No matter which color the candle is. Look at the body. If it is small, then you can consider this pattern.
- Long lower shadow. The next criterion is a long shadow below the candle. The longer the shadow, the stronger the pattern is (a long wick shows strong sellers’ intention).
- Little to no upper shadow. There should be almost no shadow above the body of the candle. A long shadow above turns the pattern into a doji, or spinning top, which is a pattern of indecision.
- No gap requirements. Unlike many patterns like morning or evening stars, where the gap is required, in hanging man, the previous and the next candle come without the gap.
The Psychology Behind the Pattern
Before delving deeper, it is worth looking at the psychology behind the pattern and studying the crowd behavior. The session opens, and the uptrend continues for a while. Buyers still control the market, or at least they think they are.
Next, sellers step in aggressively. The price drops hard, sometimes wiping our daily gains. Panic sets in among weaker longs. Stop losses trigger, and the lower shadow grows. However, sellers are not yet in control. The mood shifts again, and the price returns to its highest levels. What you should understand here is that large sellers are already in the market, and their next move can reverse the trend.
In short, the candle still looks like bulls regain control. However, large traders already know that the market sentiment has shifted and the next downside move can be just around the corner.
How to Trade the Hanging Man: A Simple Yet Powerful Strategy
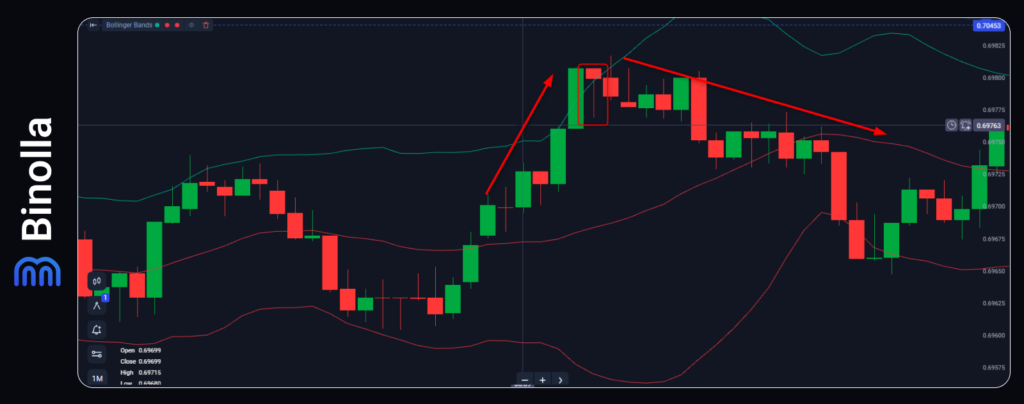
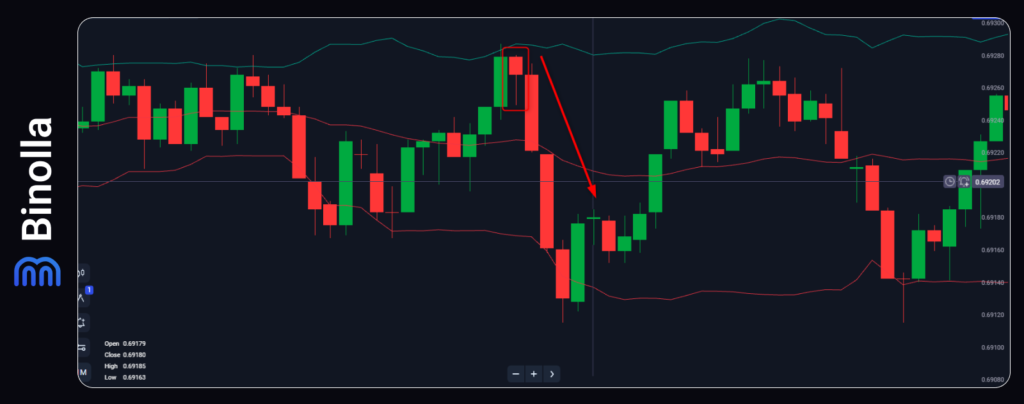
A simple hanging man trading strategy
Now is the practical part. Trading a hanging man pattern is simple at first, but you should consider a lot of things. So, let’s delve deeper and see how you can profit from this pattern.
- Confirm the uptrend. Before even thinking about buying a Lower contract or selling an asset, you should look at the market context. The pattern appears at the top of the uptrend. Therefore, you should confirm that the upside is developing.
- Identify the hanging man. Next, you need to watch the candle. It should have a small body at the top, almost no upper wick, and a long lower wick. If you confirm all of that, then you deal with a hanging man, and you can act accordingly.
- Confirm the pattern. Entering right after the candle closes is not the best solution. One of the best confirmations is when the next candle closes below the lowest point of the hanging man. However, even if the next candle is red, then you can buy a Lower contract or sell an asset.
- Set a stop-loss order. The next part is for CFD traders only. When binary traders enter, they just wait for expiration to see the results. CFD traders should also set stop losses to protect themselves from heavier risks. A stop loss can be placed somewhere above the hanging man candle.
- Define your target. CFD traders can find targets close to the nearest support levels. Or they can use a fixed risk-reward ratio like 1:2 or even 1:3.
Hanging Man vs. Hammer vs. Shooting Star
Now that you know how to trade the hanging man, let’s compare it with similar patterns with small bodies and long wicks.
| Pattern | Appearance | Where It Forms | Implication |
| Hammer | Small body on top, long lower shadow | After a downtrend | Bullish reversal |
| Hanging Man | Small body on top, long lower shadow | After an uptrend | Bearish reversal |
| Shooting Star | Small body at bottom, long upper shadow | After an uptrend | Bearish reversal |
| Inverted Hammer | Small body at bottom, long upper shadow | After a downtrend | Bullish reversal |
Common Mistakes When Trading with the Hanging Man Pattern
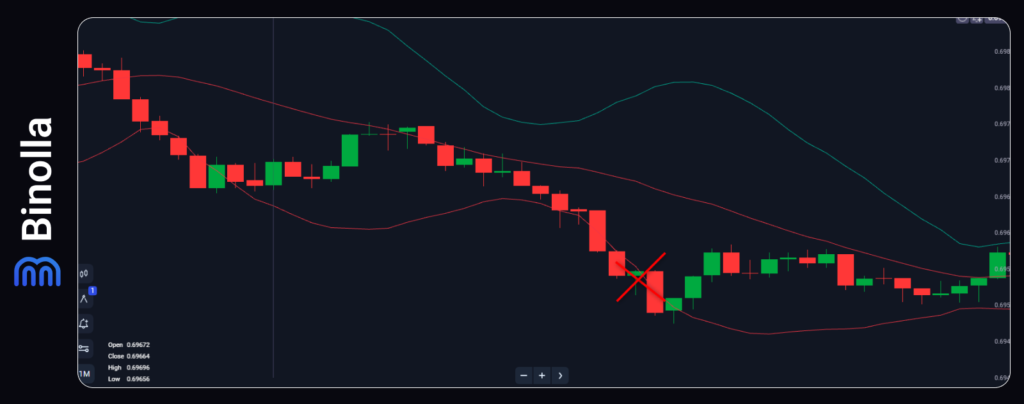
This is a hammer pattern, not a hanging man
A lot of traders who use the hanging man pattern treat it as a simple bearish reversal signal. They buy a Lower contract once the pattern appears. This, in turn, may result in losses as they do not follow some basic important rules. Here are some of the most popular mistakes traders make when they use the formation:
- Ignoring the context. The same candle found during the downtrend led to different results. If you are scanning just for the shape, your analysis may fail. The hanging man should appear at the top of the uptrend only!
- Trading without confirmation. The next important mistake is when traders press the button right after the candle closes. Before entering a trade, make sure that the market shows more signs of a reversal. For instance, you should check whether the next candle closes below the lowest point of the hanging man or, at least, the next candle is bearish. If the next candle closes above the hanging man, wait for other confirmations.
- Ignoring volumes. A hanging man on heavy volumes is far more important than one on low volumes. If you trade on low volumes, you can be trapped by market noise.
- Forgetting the bigger picture. If a hanging man appears at a major resistance, you can expect a reversal simply because this major resistance will prevent the price from moving higher.
Volume Confirmation
Volume is often undervalued when it comes to candlestick trading, but it is a powerful filter for a hanging man. High volume means a strong participation in the selloff. This raises odds of a real reversal.
Low volume means little participation. The pattern is weaker. You can be trapped in market noise. When it comes to rising volume on the confirmation candle, then sellers become stronger, and this becomes an ideal setup for trading. On the other hand, falling volume on the confirmation candle means sellers become weaker, which means that the pattern may fail.
Risk Management for Hanging Man Trades
Risk management is an important part of trading when it comes to any strategy. It becomes the difference between surviving and blowing up. Here are some important rules that you should follow:
- Position sizing. Both CFD and binary option traders should follow strict money management rules. Do not risk more than 10% of your balance in a single trade. The pattern is a reversal signal against the prevailing trend. Therefore, there is no reason to invest more.
- Stop losses. Binary option traders can skip this part, while CFD traders should pay close attention to this. A stop loss can protect you from excessive risks. Moreover, once a stop loss placed, do not move it higher, as the uptrend may resume.
- Scaling out. Traders can open more than one trade after a hanging man. For instance, if you buy a Lower contract at the resistance level, then you can add to this position after the reversal is confirmed. This will allow you to benefit from more money without additional risks.
- Avoid correlated trades. If you buy a Lower contract at EUR/USD after a hanging man pattern, do not rush to buy Lower contracts on GBP/USD or AUD/USD. While assets correlate, you should first find reversal signals in those assets before entering a trade.
- Keeping a trade journal. This is one of the most important parts of trading. After placing a trade, add a record to the journal about the pattern and your emotional state. This will help you analyze your trades and find mistakes later.
Advanced Nuances of Trading with Hanging Man
Body color of a hanging man matters slightly
Now that you know the basics, some finer points will separate solid traders from great ones. Here are some last recommendations that will help you improve your results:
- Body color matters slightly. A red body on a hanging man is slightly more bearish than a green body. The difference is small, but if you are unsure, do not enter on a green hanging man.
- Shadow length is important. A shadow should be twice the body length. Not shorter. Three times is strong. Five times is a major warning that the upside is almost over.
- The open location gives you a clue. A hanging man that appears above the high of the previous candle tells you that there was a gap, but bulls failed to push the price higher. This is an extra bearish confirmation.
- Failed hanging men are informative too. If a hanging man closes and then the next candle goes above it, that’s a bullish signal. Some traders use these patterns for entries as well.
- Confirmation by correlated assets. If a hanging man is formed on EUR/USD and you see that GBP/USD or AUD/USD is moving lower, then the signal becomes stronger.
Conclusion
The hanging man is among the most recognized patterns in trading, but it is also among the most misused so far. The shape of the formation is memorable and makes it easy to spot. However, traders sometimes confuse it with other formations or simply apply it wrong in their strategies. In this article, we have described it from A to Z so that you can start using it right away. When finding a hanging man, do not forget about confirmation and context as they will directly impact your trading results. Used correctly, the hanging man pattern can become a powerful trading tool in your arms.
FAQ

Is a hanging man bullish or bearish?
A hanging man is a bearish pattern. It appears at the top of the uptrend and signals a potential downside reversal. However, remember that it is only a warning signal. You need a confirmation to trade it.
What’s the difference between a hammer and a hanging man?
Both patterns have the same candle shape with a small body and a long tail. However, a hammer is formed at the bottom of the market and signals a possibility of an upside reversal, while a hanging man is formed at the top of the market and signals a possibility of a downside reversal.
Do you need to wait for a confirmation candle?
Yes, it is recommended to wait for a confirmation candle when trading a hanging man pattern. If the next candle breaks below the hanging man’s lowest point or, at least, is bearish, then you can open a Lower trade.
Can a hanging man appear in a downtrend?
If the candle of this shape appears during the downtrend, it is called a “hammer” and signals a possibility of an upside reversal.
How reliable is a hanging man?
The pattern itself gives roughly 41% of successful trades. However, with confirmation and during periods of high volume, its reliability increases by 70%+.