Parabolic SAR Indicator: Basics, Strategies, Recommendations

Parabolic SAR is a trend indicator that was developed by Welles Wilder in 1978. It can’t be considered a very popular indicator, especially when you compare it to moving averages, Bollinger Bands, and many others. By reading this article, you will find out more about Parabolic SAR, its main features, and strategies that you can apply when using it. Create an account at Binolla and start trading with the Parabolic SAR indicator.
Contents
Parabolic SAR Indicator Explained: Calculations and Formula
The indicator consists of a series of dots that are plotted either above or below the price bars, depending on the direction of the trend. When the dots are below the price, it indicates an uptrend and a buy signal. When the dots are above the price, it indicates a downtrend and a sell signal.
The parabolic SAR indicator is calculated using the following formulas:
For an uptrend:
PSAR = Prior PSAR + Prior AF (Prior EP – Prior PSAR)
For a downtrend:
PSAR = Prior PSAR – Prior AF (Prior PSAR – Prior EP)
Where:
PSAR is the current value of the indicator
Prior PSAR is the value of the indicator in the previous period
AF is the acceleration factor, which starts at 0.02 and increases by 0.02 every time a new extreme point (EP) is reached, up to a maximum of 0.2
EP is the highest high in an uptrend or the lowest low in a downtrend
The parabolic SAR indicator is designed to follow the price closely and to change direction when the price crosses the indicator. This means that the indicator can act as a trailing stop loss, allowing traders to lock in profits and exit trades at optimal points. To learn more about how to read the Parabolic SAR indicator, read about strategies that you can use.
How to Add the Parabolic SAR Indicator to the Binolla Charts
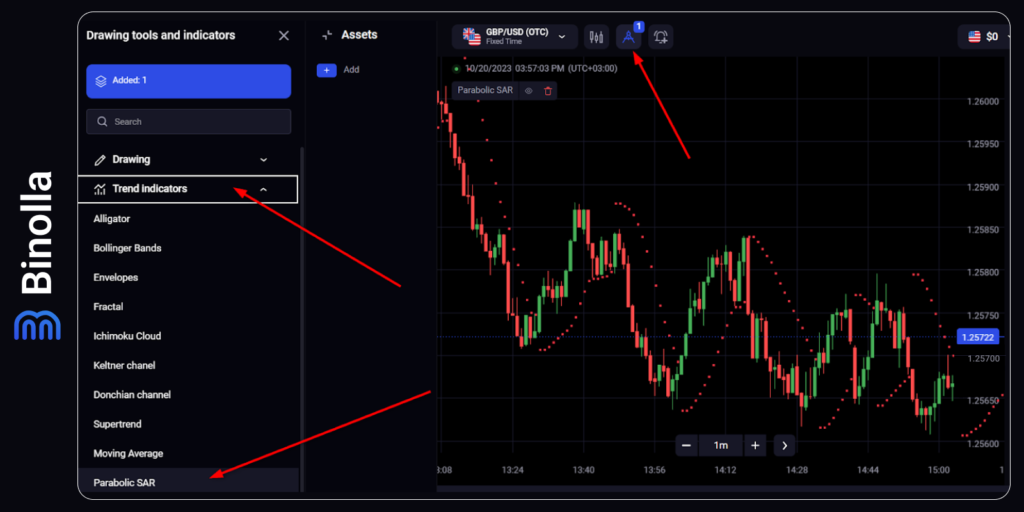
To start using the Parabolic SAR indicator on the Binolla Platform, you should complete the following steps:
- Go to the Binolla Platform and click the icon with the tools at the top of the page.
- Move the cursor to the left part of the screen and select Trend Indicators.
- Pick Parabolic SAR from the dropdown menu.
Now you can see that the indicator appears on the chart. You can also make some adjustments according to your preferences:
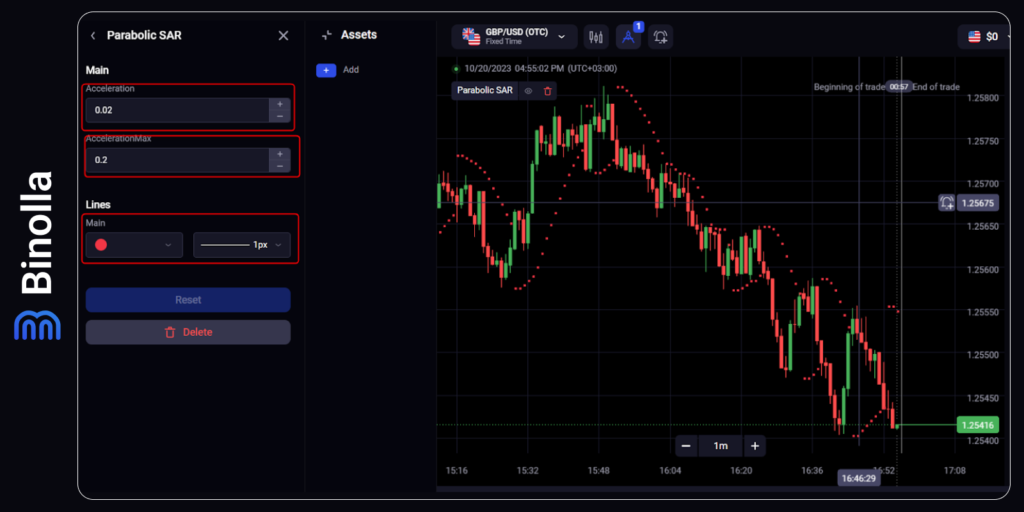
- Change Acceleration. This parameter refers to the flexibility of the Parabolic SAR line. The more you set, the less flexible it will be. On the other hand, by setting lower acceleration, you will have a more flexible line of dots, which may be a good solution for short-term strategies;
- AccelerationMax. By setting this parameter, you can define the maximum acceleration of the indicator.
- Line. This feature allows you to set the color and the thickness of dots.
Simply put, the main parameter is Acceleration. When you increase it, you will receive fewer signals as Parabolic SAR will be more aligned. You will be able to follow major trends, but if you want to trade some smaller ones, you will have to switch acceleration to lower readings. Therefore, the Parabolic SAR indicator’s best settings are those set by default, as they combine flexibility and the probability of catching smaller and medium trends.
How to Use Parabolic SAR Indicator: Strategies
You can use a lot of strategies when applying this technical indicator. Some basic ones we are going to consider in the lines that follow.
Parabolic SAR+MA Strategy
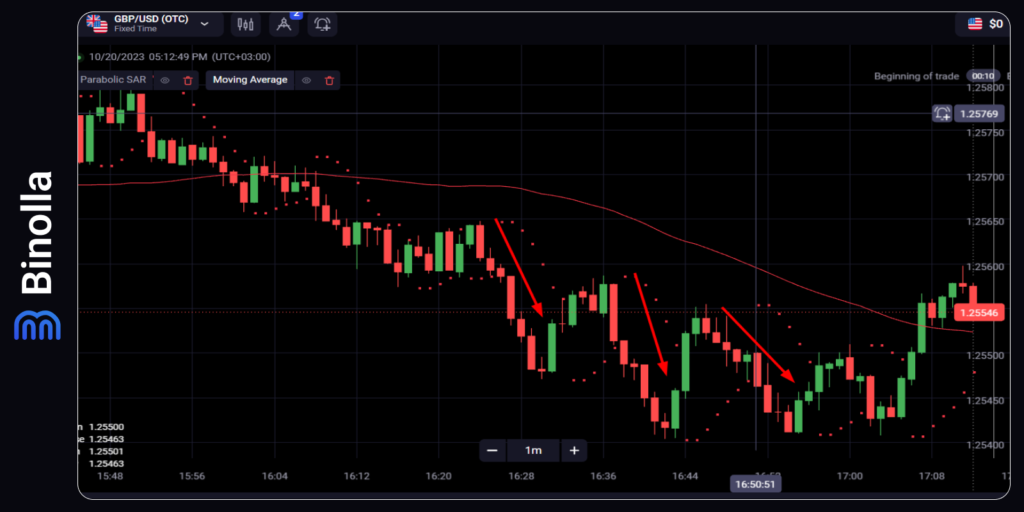
The first one includes Parabolic SAR and a moving average with a period of 60. This is a very simple tactic that will be interesting to Forex and stock traders. Moreover, this strategy can also be used by digital options traders. The idea here is to buy Lower contracts when dots appear at the top of the price while the moving average looks downward.
Forex and stock traders can use this strategy to add positions when they are trading with swing strategies. Once dots appear above the price, this means that the local correction is over and you can sell. Keep an eye on the moving average, too. The price should stay below it all the time when you are trading.
Once quotes go above the moving average, the downtrend is over. Therefore, you should use other strategies.
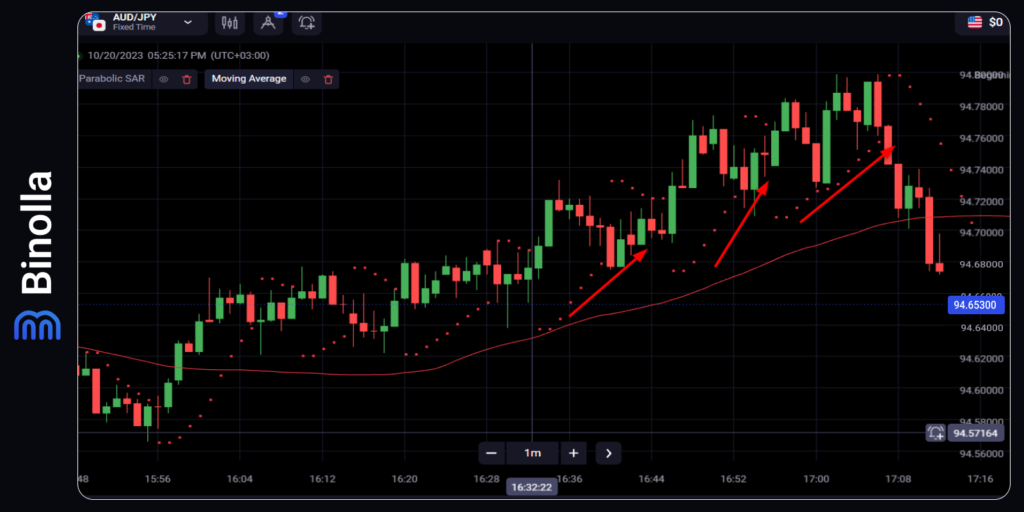
Another strategy of this type allows you to trade along the uptrend. You should use Parabolic SAR augmented by the same moving average with a period of 60. First, you should look at the direction of the moving average. It should go upward.
To buy a Higher contract, you need to wait until the dots appear below the price. Those who trade forex or stocks should buy an asset when the dots appear at the bottom of the price. You can use this strategy for your swing trading tactics and add to your current positions once a buy signal appears.
Again, you can hold your trades until the price breaks below the dynamic trendline, which is the moving average in our case.
Parabolic SAR Exit Trades Strategy
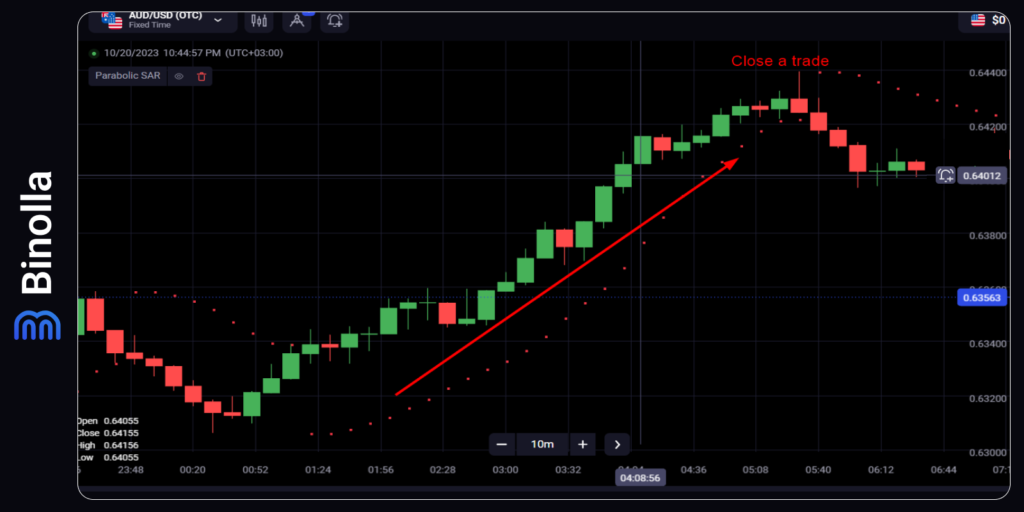
Parabolic Stop and Reverse can be useful to define where to exit trades from major and not-so-major trends. The idea behind this approach is very simple. Once the indicator changes its direction (the dots appear on the opposite side of the trend), you can exit your position. In our case, after an uptrend, the price stops, which means that you can close all your long positions.
Keep in mind that this recommendation is relevant for Forex and stock trading only. When you trade digital options, your positions will be closed automatically and you will not be required to do anything.
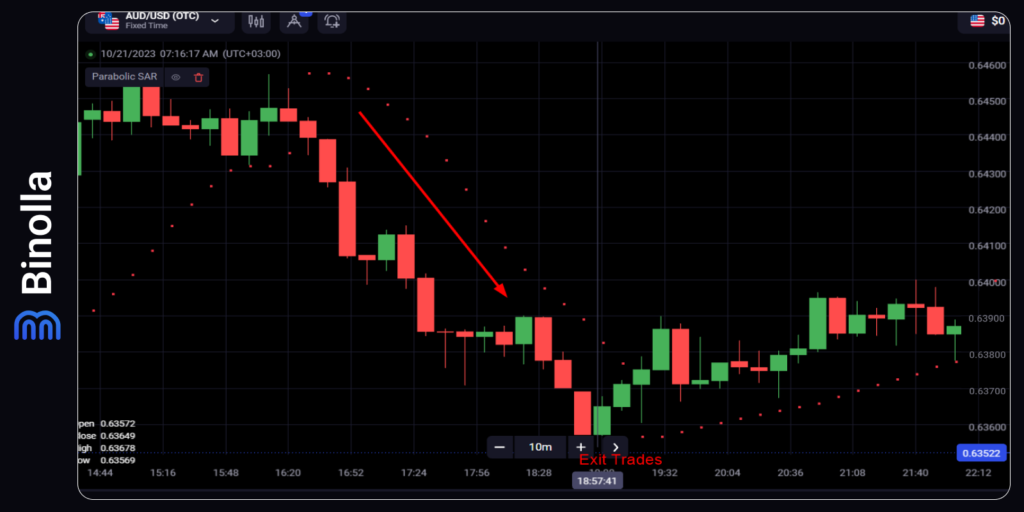
If you are trading along the downtrend, then you can use Parabolic SAR to find exit points. After it changes direction, you can close all your positions and wait for other opportunities. The idea is relevant to Forex currencies and stocks as digital options traders don’t have to do anything on their own.
The Parabolic SAR Indicator Strategy with ADX
Another strategy that you can use involves the combination of Parabolic SAR and ADX. The latter is used by many traders as an indicator that shows the strength of the current market trend. For this particular strategy, you can simply watch the position of green and red lines towards one another.
If the green line is above the red one and the distance between them is growing, then you can assume that the trend is bullish. You should wait for Parabolic SAR dots to appear below the price for confirmation. Once it happens, you can buy a Higher contract or buy a currency pair/stock.
To plan your goals in Forex or stock trading, you should watch for this signal to end. The best way is to wait until the ADX green line crosses the red one and goes below it. Parabolic SAR dots will appear above the price chart.
When the red line is above the green one and the dots appear above the price, this is a bearish signal, allowing you to buy a Lower contract or simply sell a currency pair or a stock.
To find exit points, you simply need to wait for the opposite signal. Once the red line crosses the green one from above and goes below it and Parabolic SAR dots appear below the price, the situation changes and you can close your short positions.
Parabolic SAR Recommendations
Some of the common rules are:
- When the dots are below the price, it indicates an uptrend and a buy signal. Digital options traders can buy a Higher contract, while Forex and stock traders can simply purchase an asset;
- When the dots are above the price, it indicates a downtrend and a sell signal. If you are trading digital options, you can buy a Lower contract in this case or sell FX currencies/stocks;
- When the dots flip from below to above the price, or vice versa, it indicates a trend reversal and a signal to close the existing position and open a new one in the opposite direction;
- When the price is moving sideways or in a range, the parabolic SAR may produce false signals and whipsaws, so it is better to use other indicators or methods to confirm the trend strength and direction. Also, to trade an asset when it ranges, it would be a great idea to switch to another indicator or simply use support and resistance levels to find entry points. Parabolic SAR is useless at this stage;
- When using the parabolic SAR as a stop-loss system, traders can adjust their stops according to the value of the dots. For example, in an uptrend, traders can move their stop-loss up to match the rising SAR value, and vice versa for a downtrend;
- Keep in mind that Parabolic SAR can redraw its readings. Therefore, it is better to use it in combination with other indicators like MA, ADX, etc. to be more sure about what exact decision to make.
Parabolic SAR Pros and Cons
The parabolic SAR (stop and reverse) indicator is a technical tool that traders use to determine the direction and strength of a trend as well as to identify potential reversal points. The indicator consists of a series of dots that are placed either above or below the price, depending on whether the trend is up or down. The dots also act as dynamic trailing stops that adjust according to the price movement.
Some of the pros and cons of using the parabolic SAR indicator are:
Pros:
- It works well in trending market conditions, especially on forex and stocks, where it can capture large price movements and profits.
- It is good at identifying cycle turns, such as pullbacks and corrections, where traders can enter or exit trades with the trend.
- It is excellent at placing a trailing stop that protects profits and reduces risk, as it follows the price closely and moves in favor of the trade.
Cons:
- It offers a lot of false signals when traded on shorter timeframes, where the price can fluctuate and cross the dots frequently, resulting in losses.
- It performs poorly during ranges or consolidation phases, where it can produce a lot of whipsaws and confusion, as it switches direction often and fails to capture a clear trend.
FAQ

What is the Parabolic SAR indicator?
The Parabolic SAR (stop and reverse) indicator is a technical analysis tool that is used to identify the direction and potential reversal points of a market trend. It was developed by J. Welles Wilder Jr., the creator of the RSI and other popular indicators.
How does the Parabolic SAR indicator work?
The Parabolic SAR indicator works by plotting a series of dots on a price chart, either above or below the price bars, depending on the direction of the trend. A dot below the price indicates a bullish trend, while a dot above the price indicates a bearish trend. When the dots switch positions, it signals a possible trend reversal.
How do traders use the Parabolic SAR indicator?
Traders use the Parabolic SAR indicator to determine entry and exit points for their trades, as well as to set trailing stop-loss orders. The indicator can help traders capture profits during a strong trend, but it can also generate false signals during a sideways or choppy market. Therefore, traders often combine the PSAR with other indicators or filters to confirm the trend direction and strength.
What are the advantages and disadvantages of the Parabolic SAR indicator?
The advantages of the Parabolic SAR indicator are that it is easy to use and interpret, it can adapt to changing market conditions, and it can provide clear signals for trend following and reversal trading. The disadvantages of the PSAR indicator are that it can lag behind the price action, it can produce whipsaws in a ranging market, and it can be affected by sharp price movements and gaps.


