Complete Guide to Bar Charts in Trading

Bar charts are popular among several categories of traders. They can be found on many platforms, including Binolla. This is an alternative way for traders to read price movements, discover trends, and make informed decisions.
Similar to Japanese candlesticks, bars allow market participants to see the extremum points of the price for a particular period. They also provide traders with valuable information about the open and close prices.
Some call them OHLC, which stands for Open High Low Close. Bars are very informative and apart from providing traders with some price movement insights, they allow them to find market reversals. Therefore, you can build several strategies around this method. By reading this article, traders will learn more about bar charts and how to use them in their trading sessions.
Start using bars on the Binolla right now by creating an account on the platform!
Contents
OHLC Basics
A bar chart is designed to provide traders with important information about the current price. Unlike the line, where you can see the price at a particular moment only, a bar demonstrates the open, high, low, and close prices. With all this data, you can clearly see what has happened within a particular period. For instance, if you are using a bar chart for the hourly timeframe, you can see the open and close prices as well as pinpoint both extremes.
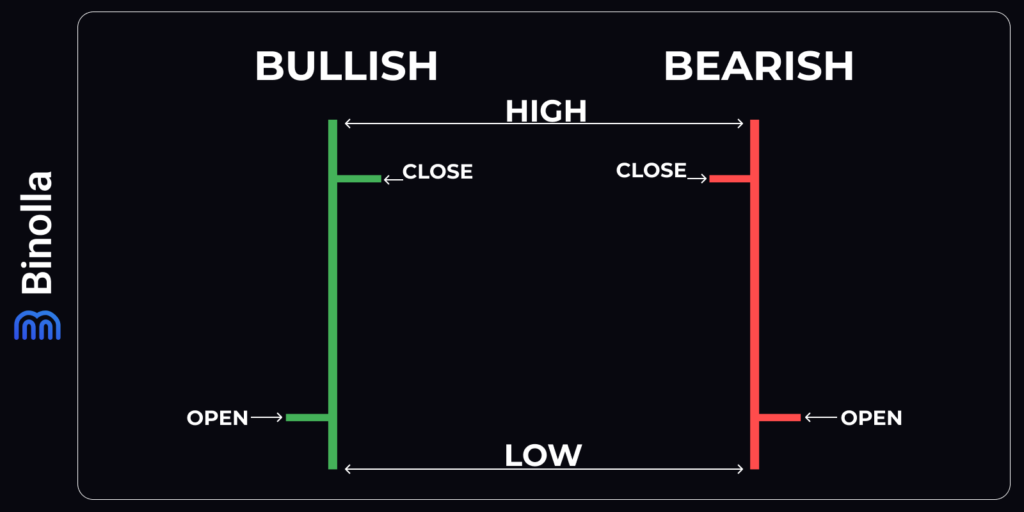
Apart from learning more about the prices for a particular period, you can also use such bars to pinpoint market trends. All bars are of two colors. The green one stands for a bullish movement, while the red one is designed to outline bearish movements.
Before delving deeper, it is worth looking at the parts of a bar to understand the meaning of each line there. First comes a vertical line, which is the bone of the bar. It helps traders to see the range of price fluctuations as well as pinpoint the extremes.
The extremes of the vertical lines demonstrate the highs and lows for a particular period. The one at the top shows the highest point that the price reached, while the one at the bottom outlines the lowest price.
Horizontal lines are designed to show open and close prices. The one on the left side is for the open price, while the one on the right is for the close one. Keep in mind that depending on the type of bar, the open price can be above or below the close one. In the bullish bar, the open price is below the close one as the quotes went upwards during the period. Conversely, in the bearish bar, the open price is above the close one as the quotes moved down.
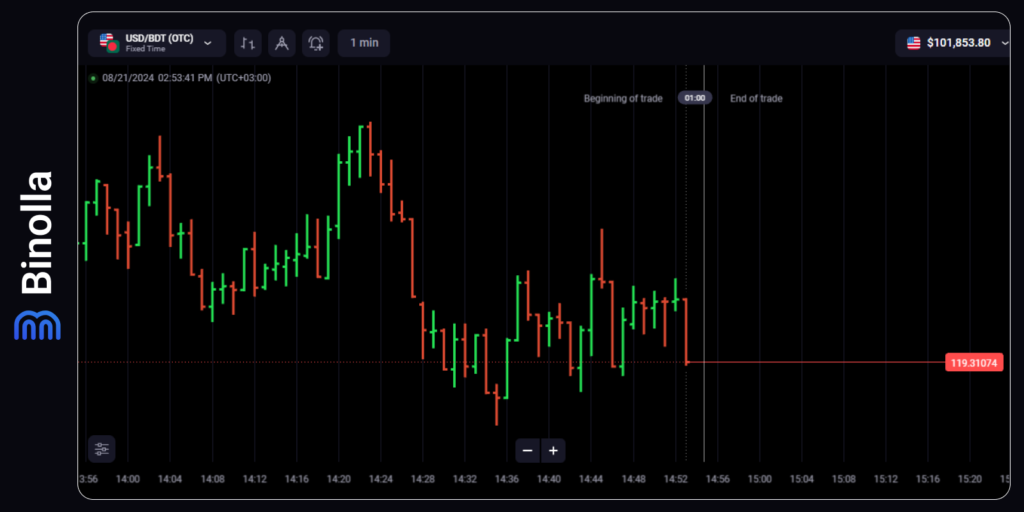
The example above shows a bar chart in action. You can see some periods where there are only green bars or only red ones. If green bars follow each other, then we can say that the trend is bullish while a series of red bars tells us about the downtrend.
How to Use Bar Charts in Trading
Finding the Right Timeframe
Similar to Japanese candlesticks, trading with bars requires defining the right timeframe. For those who prefer short-term trading, including 5s scalping, the Binolla broker offers Seconds timeframes. If you want to capitalize on price fluctuations within minutes, then you can choose Minutes timeframes.
For those aspiring to capitalize on larger price fluctuations and to profit from major trends, the platform offers Hourly and Daily timeframes. You can switch between them depending on your strategy. For instance, you can find entry points on lower timeframes, while pinpointing main trend movements on higher ones.
Using Bar Charts to Conduct Technical Analysis
Apart from simply showing traders several price stances, bars can be used by market participants to find trends and even reversals. The next paragraphs will provide you with some interesting strategies that you can use to find entry points.
Finding Trends Using Bar Charts
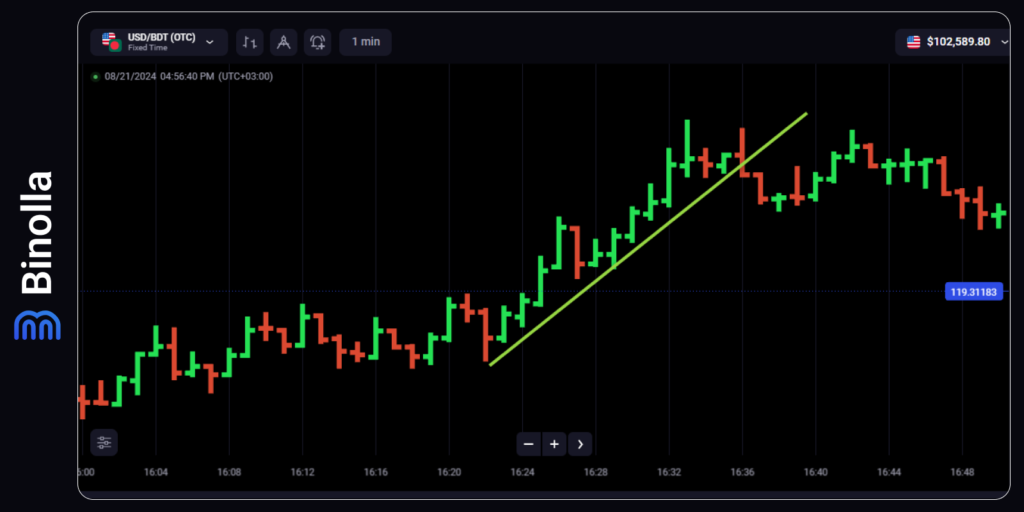
First, bars are helpful when a trader wants to outline any price movement. The image above demonstrates how one can pinpoint the uptrend. The line connects the lowest points of bars where each one is higher than the previous one.
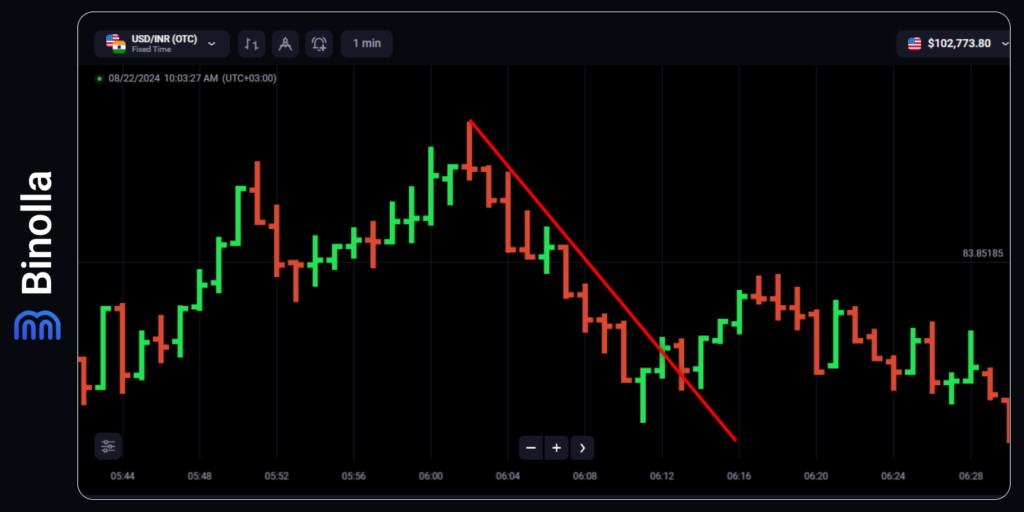
To outline the downtrend, traders can also use bars and a trendline. The simplest way to make sure that the price is going down is to connect the decreasing highs of the bar chart. As you can see, the descending line pinpoints the downtrend, allowing you to buy Lower contracts or sell FX CFDs.
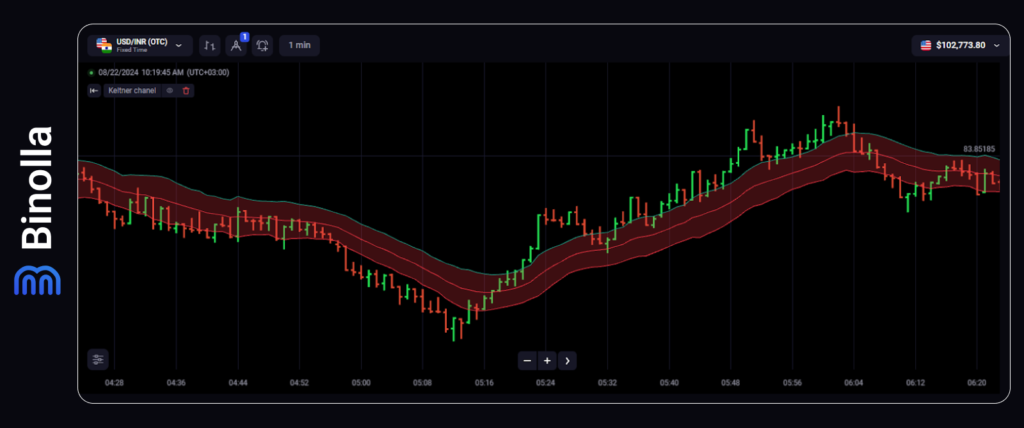
Another way to find trends when trading with bars is to use various trend-following technical indicators. In this example, we have added Keltner Channel. The downtrend is confirmed when all the lines move downwards. On the other hand, when all lines move upwards, the trend is bullish.
How to Find Entry Points Along a Trend with Bars
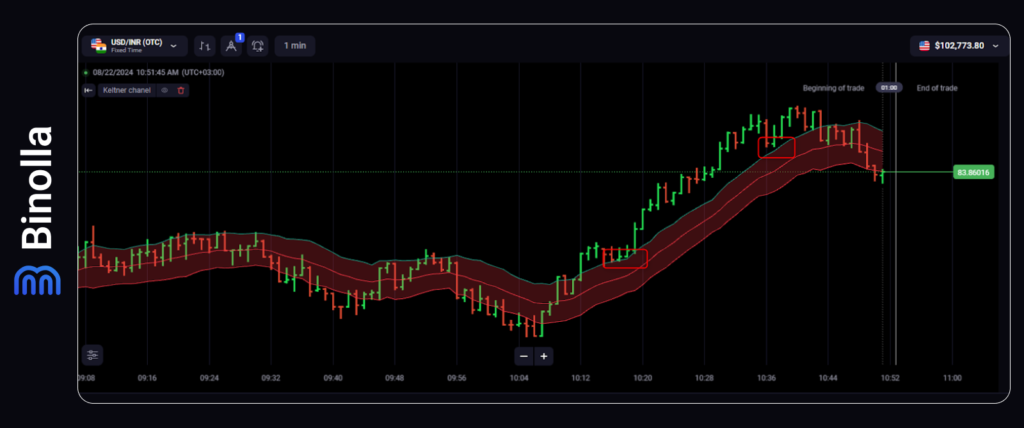
The most popular strategy that most professional traders use to find entry points when they trade with bars is to define points where the price rejects the outer line of the indicator. In this particular example, we have a couple of examples where the price rejects the higher band, which gives traders a reliable signal to buy a CFD or a Higher contract. Also, when the price is inside the Keltner Channel indicator, it tests the lower band and then reverses from there, you can also purchase a Higher contract or buy a currency pair, stock, cryptocurrency, etc.
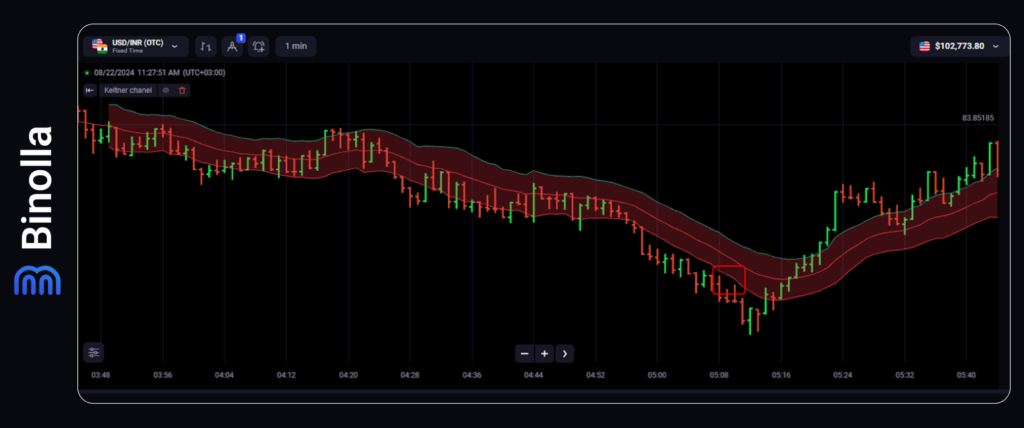
The opposite situation is when the price is below the Keltner Channel indicator. In this case, a trader should wait for a moment when the price rejects the lower band of the technical analysis tool to open a Lower contract. Forex traders can sell a currency pair, stock, or cryptocurrency.
Also, you can buy a Lower contract or sell when the price rejects the upper band of the indicator when it is within the envelope. Simply wait for this moment and engage.
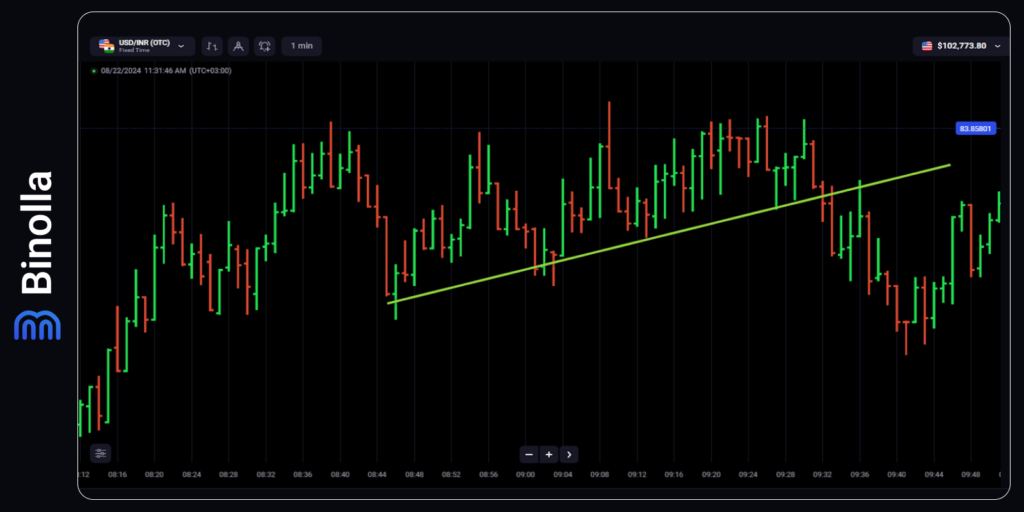
In the next example, there is an ascending trendline, which pinpoints the general uptrend. Here a trader needs to wait until the price rejects the trendline to buy a Higher contract or to buy a currency pair, stock, or cryptocurrency when they trade Forex CFDs.
Inside and Outside Bars
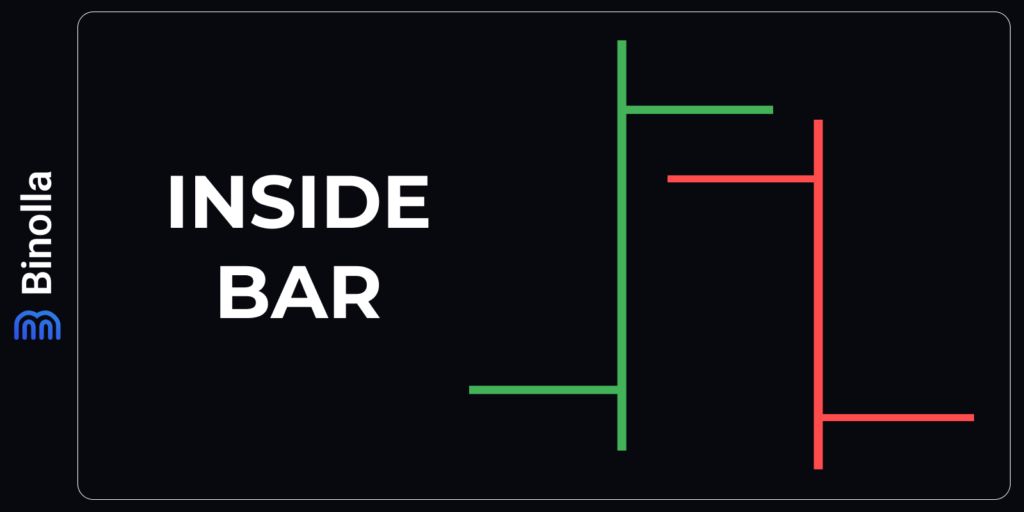
The inside bar pattern consists of two bars of different direction. The first one can be bullish or bearish and the second should be the opposite one. The idea of this patter is that the second bar should be “inside” the first one, which means that its open and close prices should be “inside” the open and close prices of the first bar.
To make it simple, let’s consider both formations. A bullish inside bar is formed with a bearish and bullish bar. The open price of the second one should be above the close price of the first, while the close price of the green bar would be below the open price of the red one.
When it comes to the bearish inside bar, the situation is the oppsite. The first bar is green and the second is red. The open price of the second bar should be below the close price of the first, while the close price of the second should be above the open of the first.
How to Trade Inside Bars
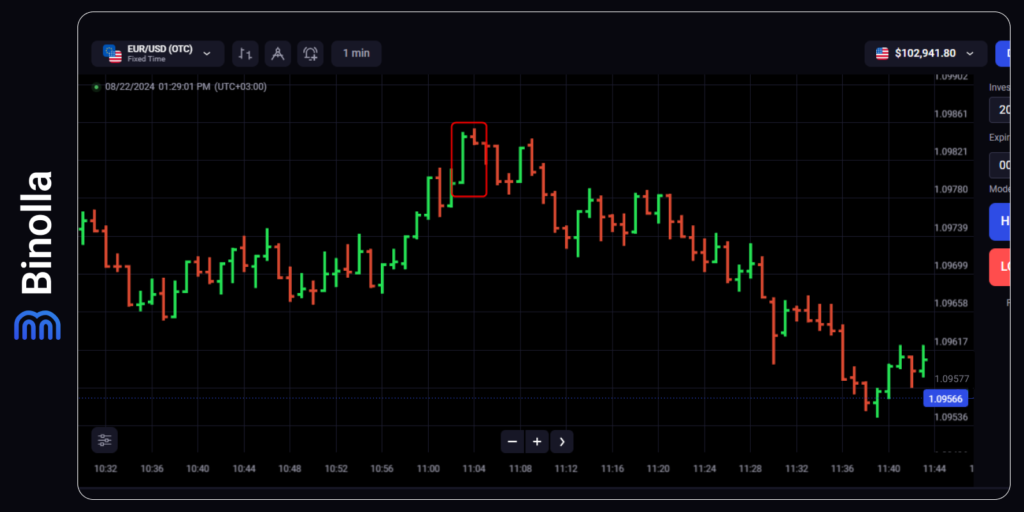
The inside bar should appear at the resistance level to be a valid reversal pattern. Once you find it there, you should wait for the bearish bar to close to buy a Lower contract. As you can see, the price moves down afterwards. Forex traders can sell in this situation.
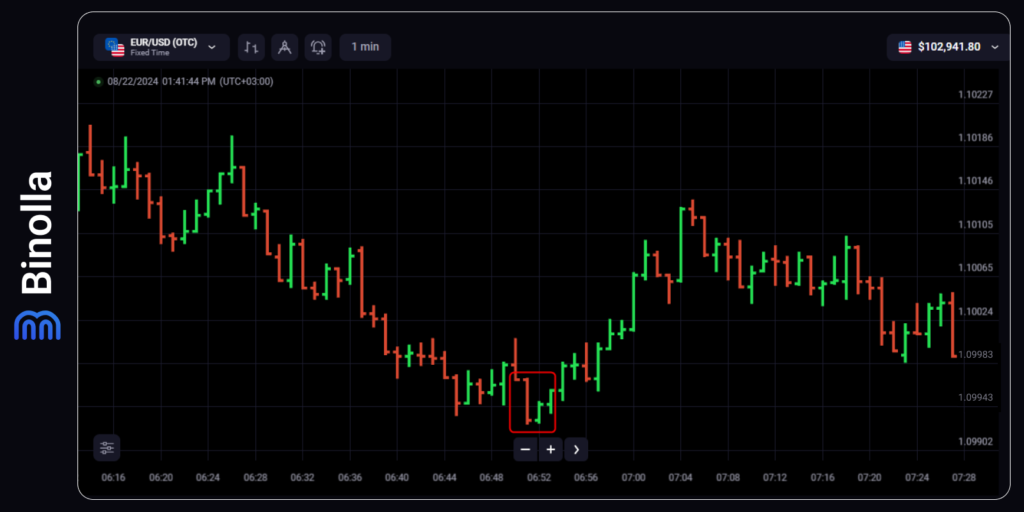
When it comes to the bullish inside bar pattern, it occurs at the bottom of the chart at the support level. Once you see it, you should wait until the green bar to close to buy a Higher contract. Forex CFD traders can buy a currency pair, stock, or cryptocurrency at this moment.
Outside Bars in Trading
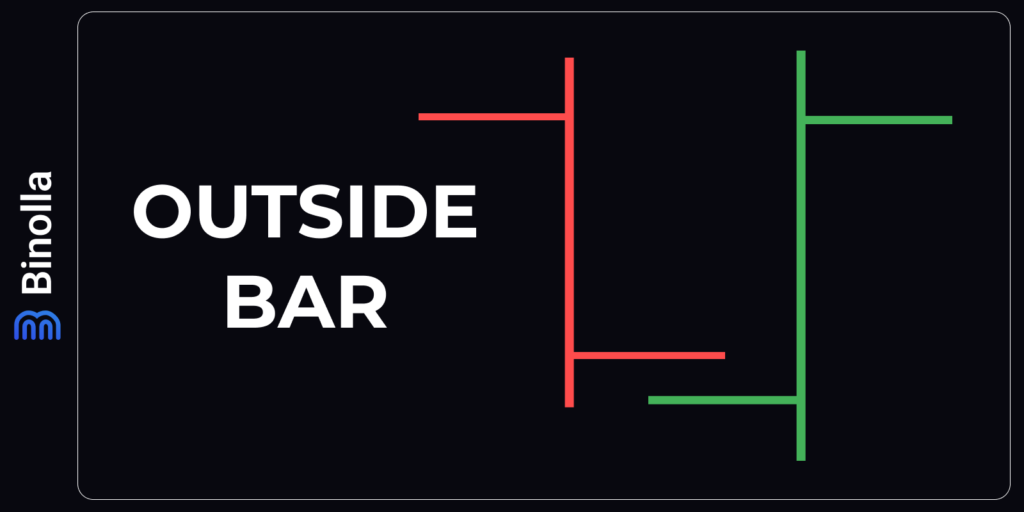
The outside bar pattern is the opposite to the inside bar, where the first bar is smaller than the second. Depending on the situation, outside bars can be bearish and bullish. Let’s have a closer look at them.
The bullish outside bar is formed when the price is at the bottom of the chart at the support level. The first bar should be bearish, while the second one is bullish. The open and close price of the bullish bar should “engulf” those of the bearish one. This pattern is similar to that known as the bullish engulfing in the Japanese candlestick analysis.
When it comes to the bearish outside bar, the first bar should be bullish, while the second one should be bearish. The second bar should “engulf” the first one, which is similar to the bearish engulfing pattern.
How to Trade Outside Bars
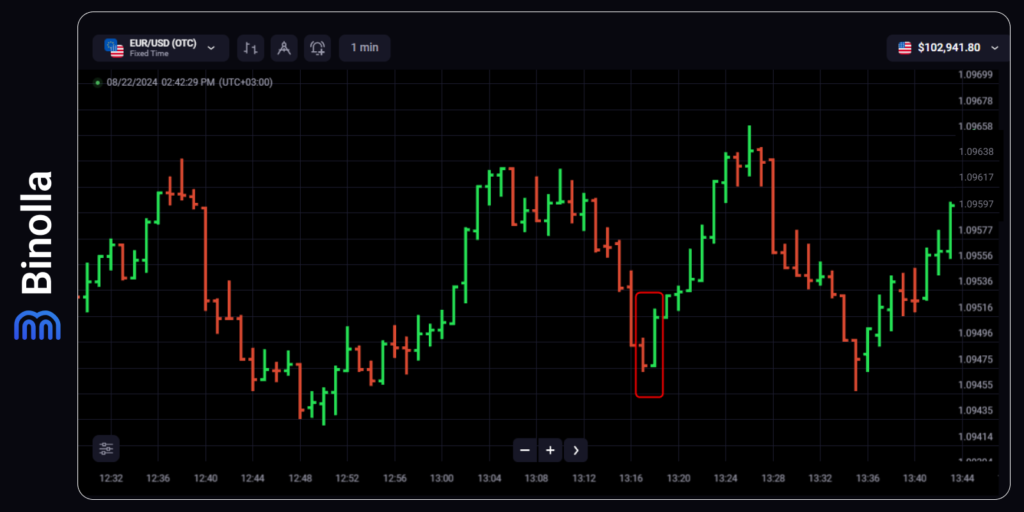
To trade a bullish outside bar, one needs to wait until the second bar of the formation is closed. Once it happens, you need to buy a Higher contract. Keep in mind that this pattern should be formed at the support level. If you are trading FX CFDs, then you should buy a currency pair, stock or cryptocurrency in this situation.
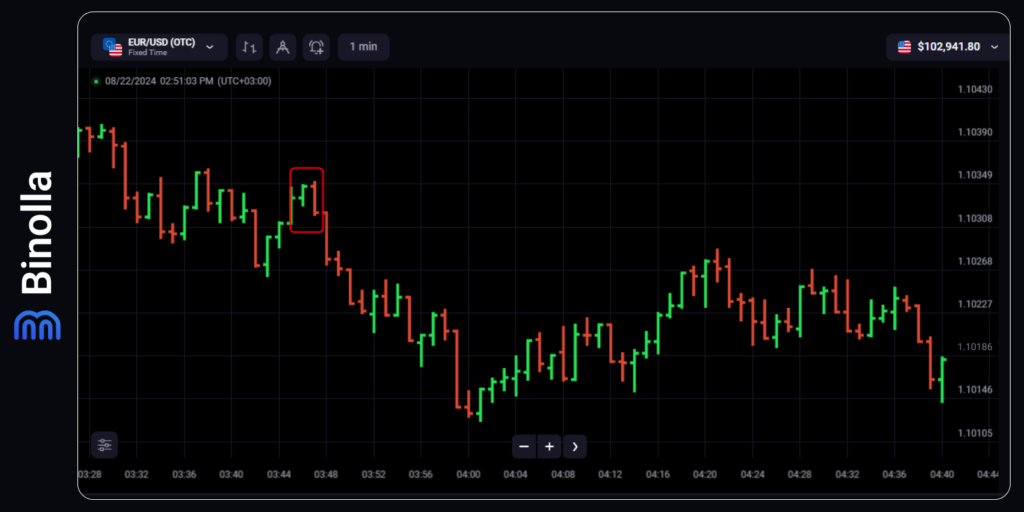
When it comes to a bearish outside bar, to trade it, one needs to wait until the bearish bar is closed. Once it happens, a trader should buy a Lower contract. The price moves down in our example, showing that you can close this trade in a profitable area. The same is true for FX CFD traders. They can sell a currency pair, stock, or cryptocurrency in this situation.
Comparing Bars, Japanese Candlesticks, and Lines
The table below shows the difference between the three of the most popular types of charts.
| Parameter | Bar | Japanese Candlestick | Line |
| Complexity | Bars are complex, especially for beginners | Medium complexity, easy to read | A very simple type of chart |
| Price information | The type of chart demonstrates open, high, low, and close prices | The type of chart demonstrates open, high, low, and close prices | Show the current price only |
| Trend visualization | Medium convenience, requires experience to identify patterns | Comfortable type of chart, easy to use to find patterns | Not as comfortable as Japanese candlesticks to reveal trading patterns |
| Technical analysis | Bars are widely used in technical analysis, they offer a variety of patterns | Japanese candlesticks are widely used to reveal trading patterns | Limited value for technical analysis, line charts are better for pinpointing trends |
| Indicator compatibility | Compatible with all types of indicators | Traders can use any indicator together with the type of chart | Lines can be used together with indicators but their reliability is lower |
| Market Noize | Less noise as compared to other types of charts | More noise especially during range trading | No noise at all |
| Popularity among traders | This type of chart is rather popular, but not as trendy as Japanese candlesticks | This is the most popular type of charts used by traders around the world | This is one of the less popular types of charts |
| Recommended for | Experienced traders who want to have more details about the price | Both beginner and experienced traders who want to conduct market analysis with price action patterns | Beginner traders to identify trends |
How to Set Up Bar Charts on the Binolla Platform
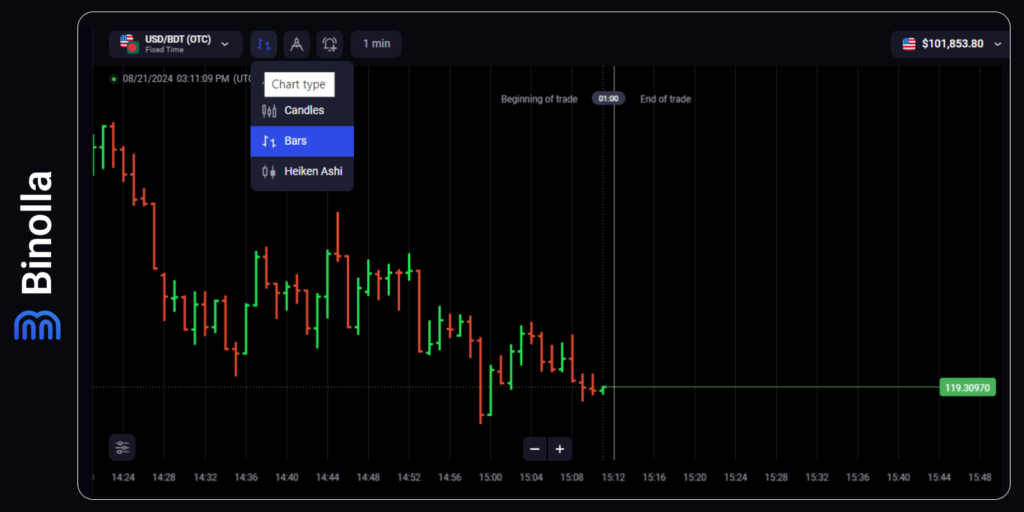
Once you register and log in to your account on the Binolla platform, you will see a candlestick chart, which is set by default. To switch to the bar chart, you need to click the icon with charts at the top of the platform and select bars there.
Keep in mind that with the Binolla platform, you can change the color of both types of bars.
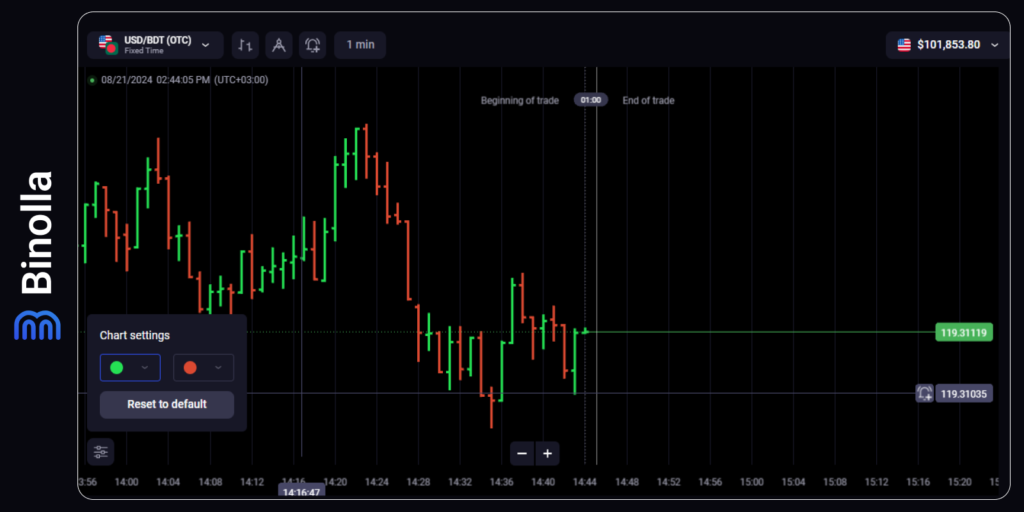
To change the color, you need to click on the settings button at the bottom-right part of the chart and switch between colors there. However, keep in mind that we are using standard colors to make it easier for all traders to read charts.
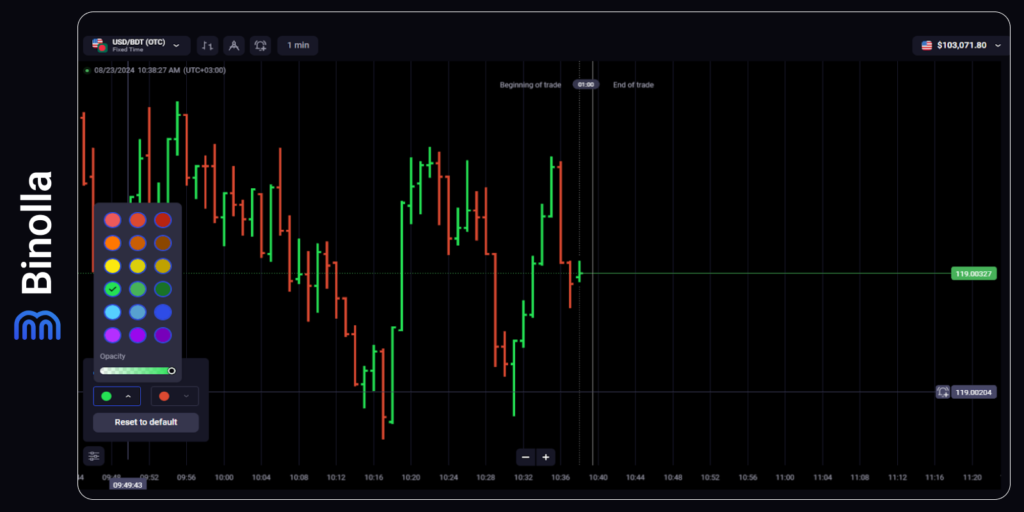
After you click on the color, you will see the palette from where you can change the color of both bullish and bearish bars.
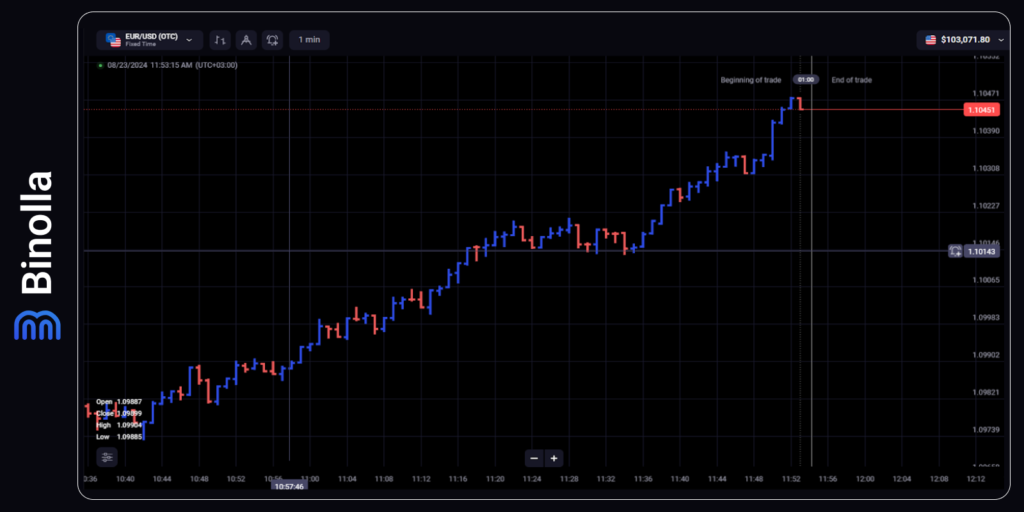
Now that’s all. You have successfully changed the color of the bars.
Pros and Cons of Trading with Bars
Bars provide traders with insight into the current situation in the financial markets. They can be both useful and overinformational. Find out more about the benefits and disadvantages of this type of chart. Pros of Trading with Bar Charts include:
- Clear price visualisation. With the bar chart, you can see the straightforward visualization of the price movements as you can see open, high, low, and close prices.
- Detailed information. Each bar allows market participants to see the price range within a particular time frame.
- Finding trends. With bar charts, traders can identify price movement directions. Whether you use naked bars or technical indicators, this type of chart will be very useful.
- Multi-market tool. Whatever financial instrument you use, you can choose bar charts to build your own strategies.
When it comes to disadvantages, they include:
- Complexity. Beginner traders may have difficulties when working with bar charts.
- Less appealing than candlesticks. Bars are not as popular as Japanese candlesticks due to their appearance.
- Misinterpretation. You should know how to interpret the bar charts before starting using them.
FAQ

What is a Bar Chart?
A bar chart consists of bars, each one representing price data for a currency pair, stock, cryptocurrency, or any other asset over a specific period. A bar demonstrates open, close, high, and low prices and offers a better visualization.
How to Read a Bar Chart?
To read a bar chart, a trader needs to look at the vertical line, which is known as the body. It shows high and low prices for a particular period. A horizontal line on the left side demonstrates the open price, while a line on the right side illustrates the close price.
Are Bar Charts Different from Candlesticks?
The idea of both is similar. Bar charts and candlesticks offer the same information to traders. However, they differ visually.
Can I Use Bar Charts for Technical Analysis?
Yes, you can. Bar charts can be used to identify market trends as well as pinpoint reversals.


