Mastering EMA Trading: A Great Tool for Spotting Trends and Timing Your Entries

Identifying trends is a great skill that every trader should have in order to succeed in trading, regardless of the financial instrument they use. The exponential moving average, or simply EMA, is a useful tool helping market participants to pinpoint local and major price movement directions. With the right strategy, this tool will provide you with a context that, in turn, will give you an opportunity to find entry and exit points. By reading this article, you will learn the basics of the exponential moving average as well as some useful recommendations on how to apply this tool.
Looking for a reliable broker to trade with? Join Binolla and choose from over 50 technical analysis tools for successful trading!
Contents
- 1 Key Takeaways
- 2 EMA Calculation: Why It Is a Powerful Indicator
- 3 How to Add EMA on the Binolla Platform
- 4 EMA: Common Settings of the Indicator
- 5 Practice trading with the indicator!
- 6 EMA Crossover Strategies
- 7 EMA: Using the Indicator as Dynamic Support and Resistance
- 8 Using EMA to Spot Trends
- 9 Comparing the Most Popular Types of Moving Averages
- 10 Mistakes to Avoid – How to Use the EMA the Most Effectively
- 11 Conclusion
- 12 FAQ
Key Takeaways
- The exponential moving average is a special moving average with the weight attributed to the recent prices.
- Traders use EMAs with different periods depending on their strategies and trading styles.
- The exponential moving average provides you with standalone signals.
- Using the EMA, you can clearly see the current price movement direction.
- When using the EMA, you should always check the context.
EMA Calculation: Why It Is a Powerful Indicator
The moving average concept was introduced in the early 1900s and was widely used to smooth financial and economic data. One of the godfathers of this method was H. Parker Willis. However, when it comes to trading itself, the concept was widely used by Richard Donchian, the famous trader who introduced his own technical indicator, known as the Donchian Channel.
With the increased speed and volatility of financial markets, traditional moving averages were replaced by their variations, including EMA, KAMA, and others. Perry J. Kaufman, for instance, introduced his own Kaufman Adaptive Moving Average, which adapts to market changes and smoothes itself in various market situations. However, the exponential moving average remains one of the most popular and time-proven variations of the moving average.
To understand the power of the exponential moving average, you should first know how this indicator is calculated and why it responds faster to fluctuations as compared to the classic simple moving average, or SMA.
The SMA uses the average of all closing prices for a specific period, like 9, 14, 20, etc., while the EMA gives more weight to the recent prices. Therefore, the exponential moving average reacts more quickly to recent market events like acceleration or reversals. This makes the indicator more powerful and valuable for traders who use strategies requiring faster reaction.
Calculating the EMA is not required, as trading platforms do all the math for traders. However, knowing how it works will be useful to understand the tool and apply it to your strategies later. Here is the formula of the indicator:
EMAtoday = (Pricetoday * Multiplier) + (EMAyesterday * (1-Multiplier))
Where:
Multiplier = 2/Period+1
Why EMA Matters in Trading
The exponential moving average is important in trading for several reasons. Here are the key ones:
- It allows market participants to spot earlier trend signals. The indicator catches movements faster than the simple moving average.
- Smaller lag. The delay of the price acceleration or pullback is smaller.
- The EMA smoothes price fluctuations. The indicator makes it easier to read charts and identify the market direction.
- Period customization. Traders can set different periods to increase the sensitivity of the indicator.
Short periods are often used for quick entries, while longer ones can be applied to long-term strategies like position trading.
How to Add EMA on the Binolla Platform
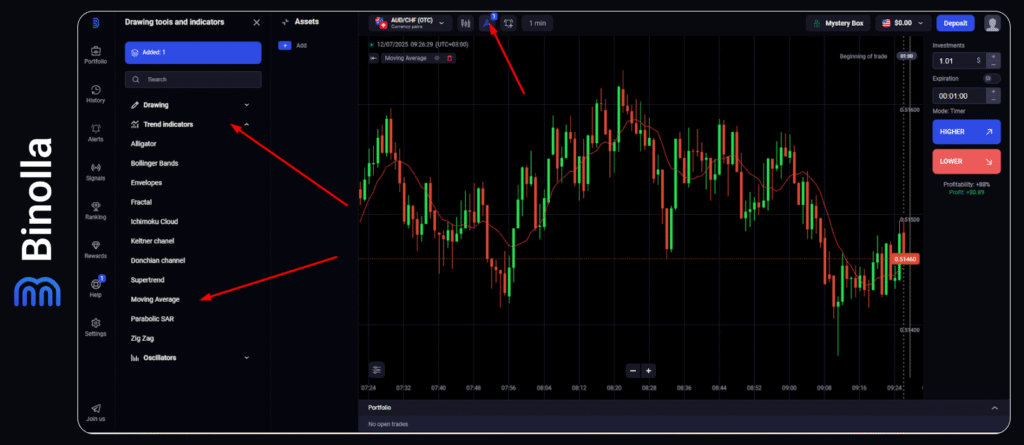
To add the indicator to the Binolla trading platform, you need to click the Tools icon at the top of the screen. Once the menu on the left appears, select trend indicators and in the dropdown menu choose Moving Average.
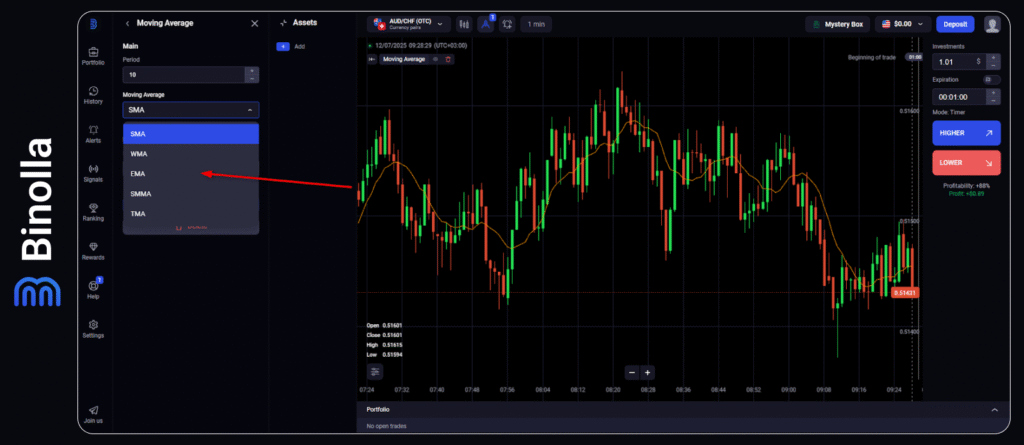
After adding the indicator to the Binolla platform, you need to choose its type. Click on the menu and choose EMA from the list. Also, if you want to change the period of the indicator, you can do it right in this menu above the moving average type selection.
EMA: Common Settings of the Indicator
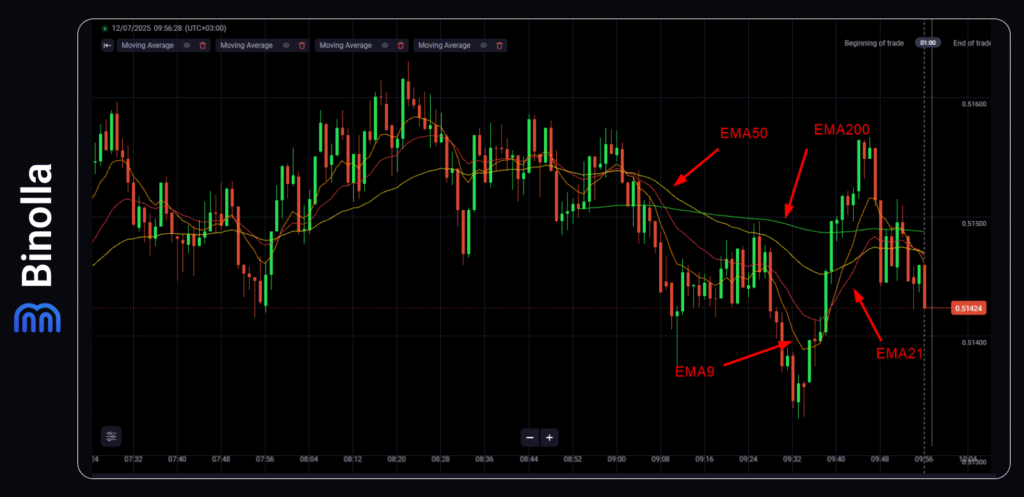
The EMA indicator is very flexible, which makes it a great tool for traders of all types. You can adjust the period on your own depending on market conditions and your strategy. Find out more about the most common settings that professional traders use when they apply the EMA indicator:
- EMA9. This is one of the most flexible settings that makes the indicator react to smaller price fluctuations. It is used by scalpers and intraday traders. EMA9 should be applied for 1 to 15-minute charts. The idea is to use the indicator for catching the market momentum and quick breakouts.
- EMA21. The indicator with these settings is the best for day trading and swing trades. The indicator should be used on timeframes from 5 minutes to 1 hour. With such settings, the indicator smoothes market noise, allowing you to see the direction clearly.
- EMA50. The indicator is better used for swing trading and trend-following strategies. It can be applied to hourly and daily charts. With this EMA, you can find mid-term trends and avoid counter-trend trading.
- EMA200. These settings are used for long-term trading only, allowing market participants to confirm overall trends. It can be applied to daily and weekly charts
Using EMAs alone can empower your strategy, but if you combine them, you can have even better results. Here are the most popular combinations:
- EMA9 + EMA21. This combination is used to spot short-time crossovers.
- EMA21 + EMA50. With this combination, you can find entries for trend-pullback.
- EMA50 + EMA200. Using this combination will allow you to have long-term trend confirmation.
EMA Crossover Strategies
One of the most effective ways to apply various exponential moving averages is to combine them and spot crossovers. The idea is to use two types of EMAs – a fast and a slow one.
Bullish EMA Crossover
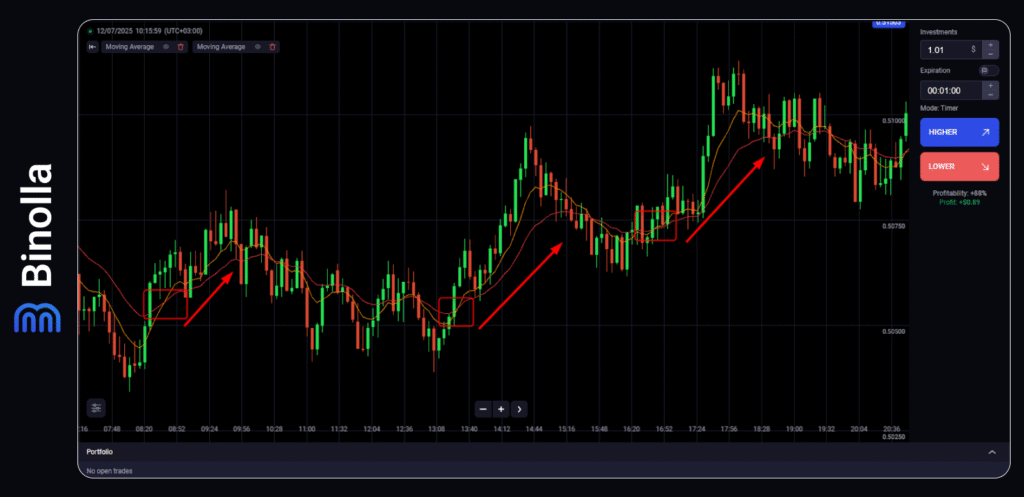
If you take two EMAs (9 and 21, for instance), you can find entry signals for bullish signals. In this particular case, when the fast EMA crosses the slower one, you can buy a Higher contract or buy an asset. Entry should be done right after the crossover.
EMA Bearish Crossover
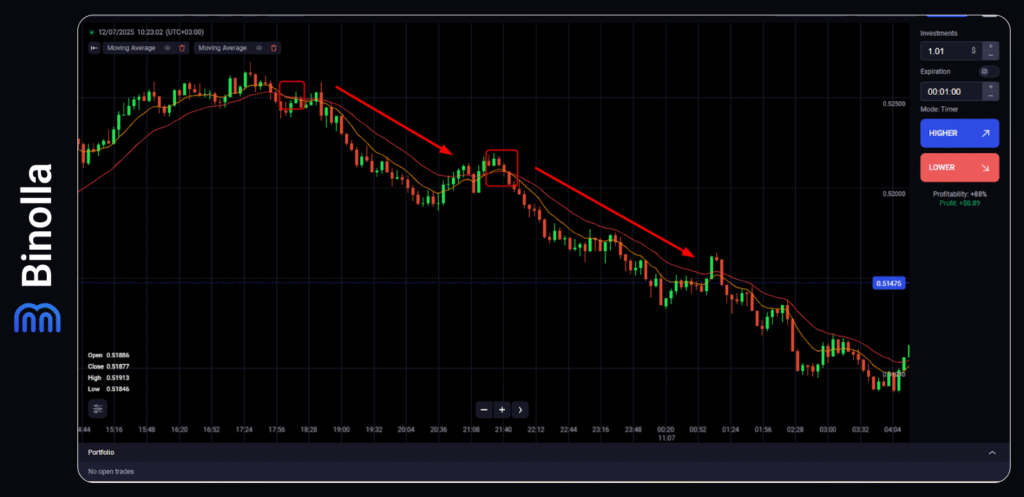
This signal comes when the fast EMA crosses the slow and moves below it. Traders can buy a Lower contract or sell when the crossover takes place. To apply this strategy, you can use EMA9 and EMA21, for instance.
To avoid false signals when using these strategies, you should check for volume confirmation first. Also, traders can switch to higher timeframes to see whether the signal is confirmed. Finally, market participants can combine this signal with other indicators, both oscillators and trend-following ones, to confirm the strength.
EMA: Using the Indicator as Dynamic Support and Resistance
The exponential moving average can be used not only to identify trading signals. Market participants apply this indicator in various strategies to identify support and resistance levels. When it comes to trending markets, the price retraces to the EMA, providing you with an opportunity to open trades along the directional movement.
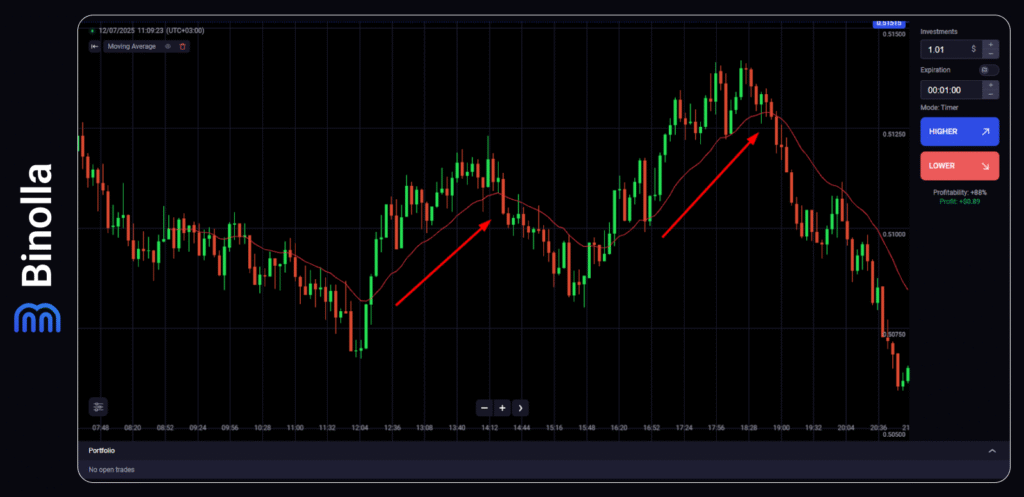
The exponential moving average can be used as a dynamic support level during the uptrend. As you can see, the price pulls back to the line and then resumes the upside. When trading with the EMA, you should look for a clear bullish candle before entering a trade. The best is to find a pattern like a hammer, inverted hammer, bullish engulfing, bullish harami, or any other. The signal comes when this pattern forms above or slightly below the EMA.
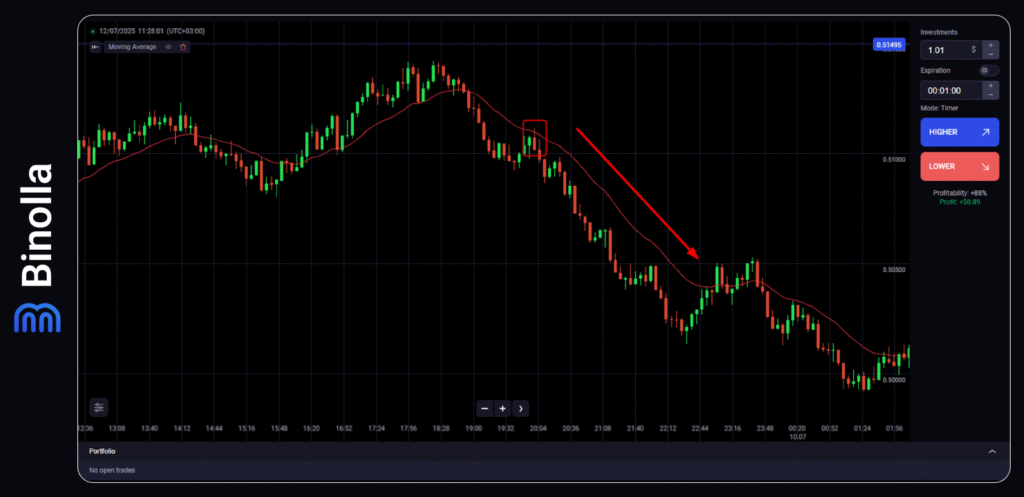
Using the EMA as a resistance level
When it comes to falling markets, the EMA can be used as a dynamic resistance level. Similar to the previous example, in this one, the price stays above the EMA and goes back to the dynamic resistance from time to time to test it. The idea is to buy Lower contracts or sell an asset when it tests the dynamic resistance.
Both cases are advantageous as compared to the standard trendlines, as they do not require you to draw anything. Moreover, when you draw a trendline, you miss at least one trading opportunity as you draw the line through two points. When it comes to EMA, it appears automatically, and you can search for entry points right after the reversal and the beginning of a new trend.
Using EMA to Spot Trends
Traders often use the EMA to spot market trends. The slope of the exponential moving average allows you to see the current price movement direction. Moreover, with this indicator, you can filter trends and range markets.
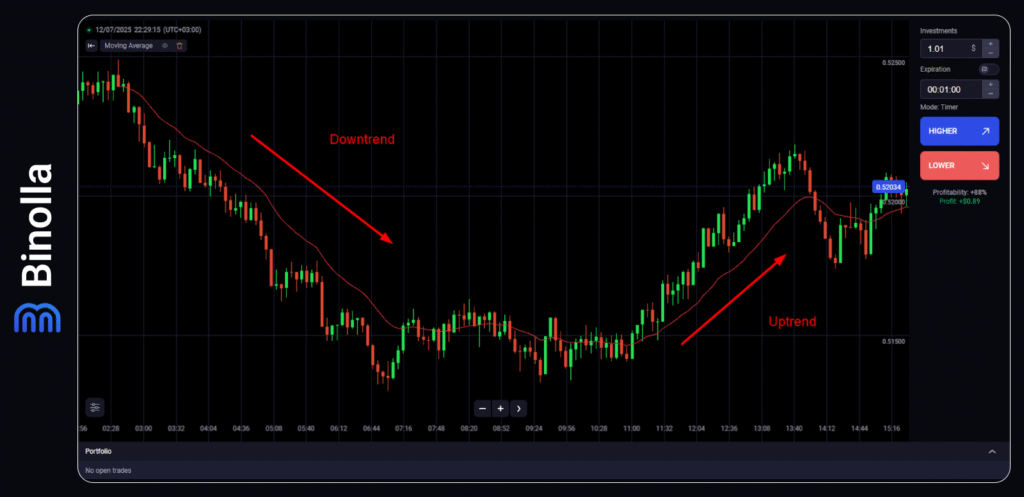
The angle of the EMA slope is the key signal. If the price is below the exponential moving average and the line is moving downside, then the trend is bearish. On the other hand, if the price is above the EMA and the line is moving upward, the trend is bullish.
If there is no clear slope of the exponential moving average, then the market is choppy. How to use this information? While identifying a trend is not a strategy with clear entry points, this approach can augment any of your strategies by providing you with a clear picture of the current market context. For instance, you can check the current trend and then find candlestick patterns to open trades in the same direction. Moreover, if you see a reversal signal and the trend is strong, then you should avoid trading and wait until the swing is over to buy or sell in the direction of the major trend.
Comparing the Most Popular Types of Moving Averages
With a variety of moving averages, it may be difficult for a trader to choose one that best suits their strategies. Here is a table comparing all the existing and most popular types of MAs.
| Type | Key Features | Best Use |
| SMA (Simple Moving Average) | Equal weight to all prices in the period; smooth but lags in fast markets | General trend identification |
| EMA (Exponential Moving Average) | More weight to recent prices; reacts faster than SMA | Short-term trading, faster signals |
| WMA (Weighted Moving Average) | Linear weights favor recent data; more responsive than EMA | Momentum trading, short-term reversals |
| SMMA (Smoothed Moving Average) | Like EMA but slower; filters out minor fluctuations | Long-term trend following |
| HMA (Hull Moving Average) | Smooth and very responsive; reduces lag using WMA logic | Scalping, algorithmic, and fast markets |
| TEMA (Triple Exponential Moving Average) | Combines multiple EMAs to minimize lag | Fast-moving instruments (crypto, indices) |
| VWMA (Volume Weighted Moving Average) | Weighs prices by trading volume; reflects real market sentiment | Stocks with strong volume-price correlation |
| KAMA (Kaufman Adaptive Moving Average) | Adjusts to market volatility; faster in trends, slower in noise | Adaptive systems, volatile or mixed markets |
Mistakes to Avoid – How to Use the EMA the Most Effectively
The exponential moving average is among the most useful tools helping traders identify market trends and even find entry and exit points. However, some traders new to this indicator may misuse it, which leads to losses. Here are the most common mistakes to avoid when trading with the indicator:
- Using the crossover signal without the context. Many beginner traders use the crossover as the default signal and trade once they spot it right away. The problem is that if there is a clear trend, then the crossover may provide you with clean entry points. However, in choppy markets, crossovers are dangerous as they appear one after another, and traders get confused. The solution here is to use another EMA with a higher period to identify the trend and apply the signal only if the trend is confirmed.
- Buying or selling from the EMA without focusing on the market structure. Some beginner traders buy Higher contracts when the price is testing the EMA from above and buy lower contracts when the price is testing the EMA from below. The biggest mistake here is that they do not pay attention to confirmations when entering the market. If the price is testing the EMA from above, then you should check whether there is a candlestick reversal pattern there before engaging.
- Using the same EMA settings across all timeframes. When choosing a period for the EMA, you should clearly see which timeframe you are going to use. For instance, EMA9 or EMA21 are better for minute and hourly timeframes, while EMA200 is great for daily and weekly scales. There is no one-size-fits-all setting that you can apply to all timeframes and across all markets.
- Adding too many EMAs on charts. Another problem that many beginner traders face is that they add too many versions of the EMA with different periods. The best option is to add two or three EMAs. For instance, you can use EMA9, EMA21, and EMA50. Adding more will not be helpful and may even lead you to losses.
- Not using risk protection orders. While the EMA can be used as a dynamic support and resistance level, and you have seen it bouncing off the line several times, ignoring stop losses may lead to negative consequences. The price may break through the line at some point and start moving in the opposite direction. Therefore, when using EMAs in your trading sessions, do not forget about placing stop losses.
Conclusion
The exponential moving average is a powerful tool that many professional traders use in their sessions. This indicator helps market participants identify trends, find closest support and resistance levels, and even spot signals that traders and investors can use to enter the market. However, like any other indicator, successful trading with the EMA depends entirely on your actions and your knowledge. To make money using this tool, you need to understand the market structure, use volume and momentum indicators, as well as apply strict money and risk management strategies. With all this in mind, you can build a powerful trading strategy based on the EMA indicator.
FAQ
What is the Best EMA Period for Trading?
There is no best period for trading with the EMA. The indicator can be applied to various scales from seconds to months. However, you should adjust its period according to the timeframe that you are going to use. For instance, EMA9 works better on smaller timeframes, while EMA200 can be applied for longer-term timeframes like weeks and even months.
Can I Use Strategies Based on EMA Alone?
There are several crossover strategies that you can use without adding any other tools. Moreover, you can use a single EMA to identify trends. However, the best solution is to add at least one more indicator or pattern system to improve your trading results.
How to Avoid False EMA Crossovers?
False EMA crossover signals often appear during choppy markets when there is no clear price movement direction. To avoid them, you should confirm the trend first. Moreover, you can also use volume or momentum indicators to see that there is a trend and the market is moving in a specific direction instead of fluctuating inside a narrow range.
Which Timeframes Are the Best for Trading with EMAs?
Selecting the timeframes depends entirely on your trading style and goals. When trading with the EMA, you can choose any of the existing timeframes. However, you should keep in mind that the indicator should be adjusted properly for each particular scale.
No posts found


