Ichimoku Cloud (Ichimoku Kinko Hyo) Basics: How to Set Up and Use the Indicator

Many traders are well aware of Japanese candlesticks and use them in their everyday trading routine. However, this is not the only tool that comes from Japan that you can apply for analyzing price fluctuations. Ichimoku Cloud in Forex and digital options is an indicator that is based on moving averages and allows you to build a whole trading system around it. By reading this article, you will discover the basics of the technical analysis tool, how to apply it to the Binolla charts, as well as some interesting strategies. Start trading with Binolla and use these trading systems to become a successful trader.
Contents
- 1 Ichimoku Cloud: What’s Under the Hood
- 2 How to Apply the Ichimoku Indicator to the Binolla Charts
- 3 Evaluate the Ichimoku indicator in practice!
- 4 How to Read Ichimoku Cloud
- 5 Ichimoku Cloud Basic Strategies
- 6 Chikou Span Explained
- 7 How to Place Stop Losses and When to Exit When Trading with Ichimoku Cloud?
- 8 Pros and Cons of Using the Ichimoku Cloud Indicator
- 9 Key Recommendations for Using Ichimoku Cloud
- 10 Conclusion
- 11 FAQ
Ichimoku Cloud: What’s Under the Hood
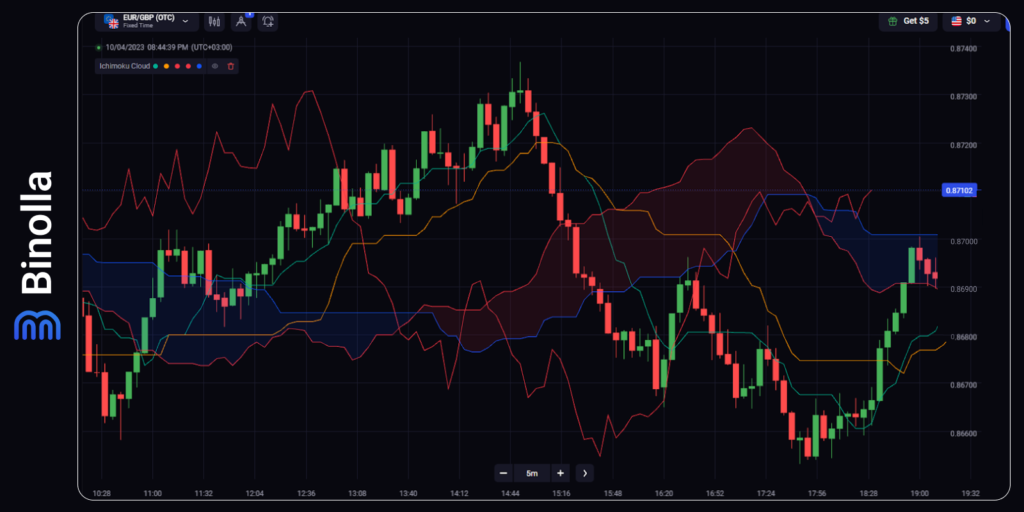
The indicator comprises five lines, two of which form the famous Ichimoku cloud. Find their description below:
The Ichimoku cloud comprises Senkou Span A and a 52-period Senkou Span B. The main idea of the cloud is to define the current trend. If Senkou Span A is higher than Senkou Span B, the trend is bullish, while in the opposite situation, the trend is bearish. If the price fluctuates within the cloud, the market is in the range and it is better to avoid trading. Thick cloud tells us about high volatility, while when it is thin, the volatility is low;
Tenkan Sen. This line represents a moving average with a period of 9. It can be used to define the current trend. If it goes up, the uptrend is developing, while if Tenkan Sen goes down, bears are dominating the market;
Kijun Sen. This is a 26-period moving average that is also used to define trends. It works together with Tenkan Sen to allow traders to find entry points;
Chikou. It is also known as the delay line and it is shifted to 26 periods forwards, which allows us to compare the current market situation with the situation that took place 26 candles ago.
How to Apply the Ichimoku Indicator to the Binolla Charts
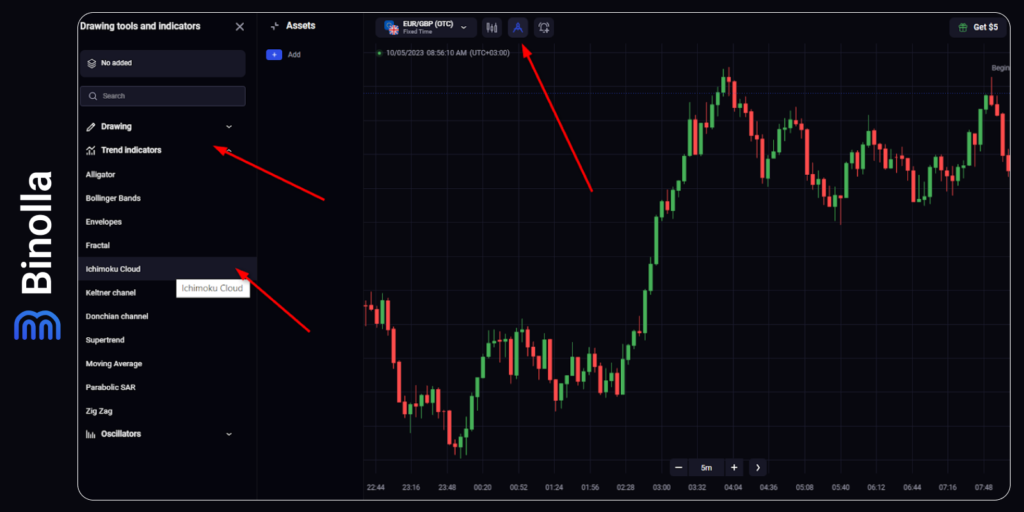
To start using the Ichimoku Cloud indicator, you need to apply it to charts first. With Binolla, you can do it in a couple of clicks:
- Go to the platform.
- Move the cursor to the top part of the platform and click on the icon with tools.
- Move the cursor to the left part of the screen and click Trend Indicators there.
- In the dropdown menu find Ichimoku Cloud and click on it.
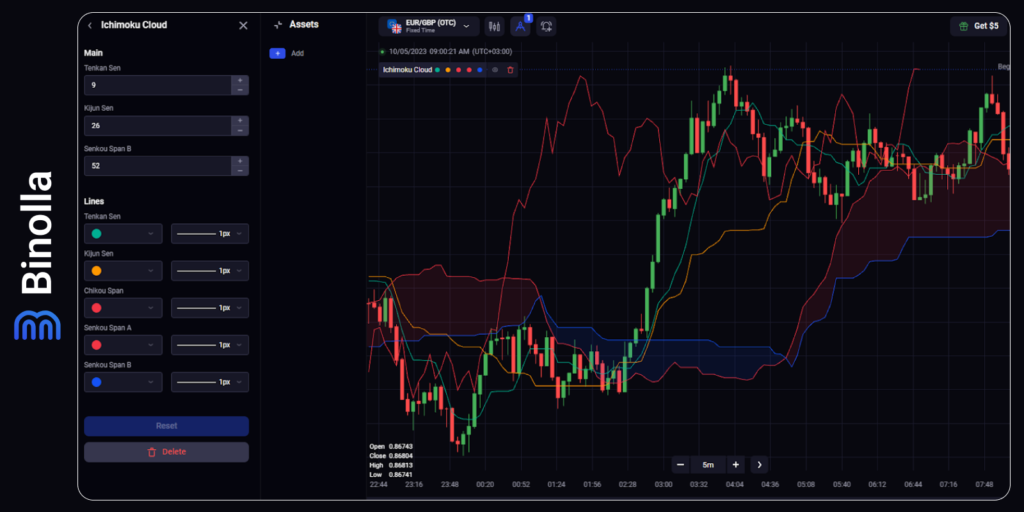
After you add the indicator to the charts, it is time to set it up. Ichimoku Kinko Hyo was designed with periods that were set by its developer.
The 9-period MA smooths the price enough, but it is still flexible and reacts to minor price fluctuations, while the 26-period MA (Kijun) is less flexible and slower, which is better when you need a clear picture of the current trend. As for the 52-period Senkou Span B, it is the slowest line that indicates the current trend and acts as a support and resistance line depending on where the price is at the moment.
Therefore, it is better not to change them if you want them to work as planned by the man behind this technical analysis tool.
How to Read Ichimoku Cloud
The Ichimoku Cloud trading indicator consists of the cloud itself, which is arguably the most important part of the tool, and three other moving averages that can also be used by traders to define trends and market volatility.
If the price of the stock, currency pair, or other asset stays below the cloud, we can state that the downtrend is dominating. On the other hand, when the price of the asset stays above the cloud, the uptrend is developing. Therefore, by using the cloud solely, you can understand which price movement direction is currently relevant for a particular asset.
Tenkan and Kijun are also of great importance when you trade with the Ichimoku Cloud indicator. Tenkan with a period of 9 is regarded as a fast-moving average, while Kijun with a period of 26 is a low one. When both move upwards, then you can suggest that the uptrend is prevailing, while when both move downwards, the downtrend is developing.
Ichimoku Cloud Basic Strategies
There are plenty of strategies that traders can use when they are trading with this technical indicator. We are going to provide you with some basic ones that may be helpful to you especially if you are new to this technical analysis tool.
Ichimoku Cloud Strategies
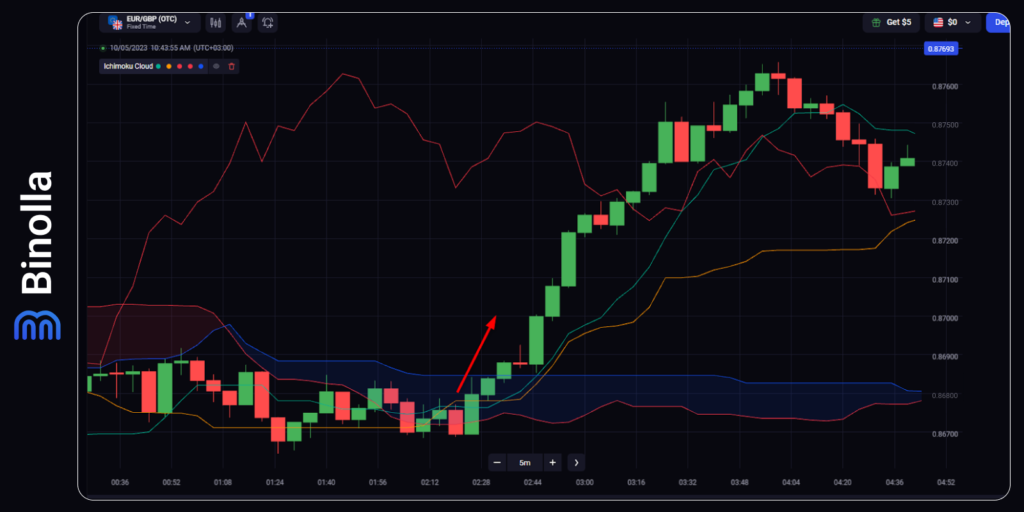
This is a very simple strategy that involves the Kumo cloud only. When the price goes upwards and makes a breakout of the upper border of the cloud, you can buy a Higher contract or purchase a currency pair/stock. The best moment to buy is when the breakout is confirmed, i.e., when the breakout candlestick is closed. However, you can take some more risks and open the trade once the breakout happens. There is an additional signal that you can find on the chart in the situation. Both Tenkan and Kijun move upwards with Tenkan staying above Kijun.
The upper band of the cloud acts as the resistance level in this case. Therefore, if it is broken by the price, you can expect a momentum movement.
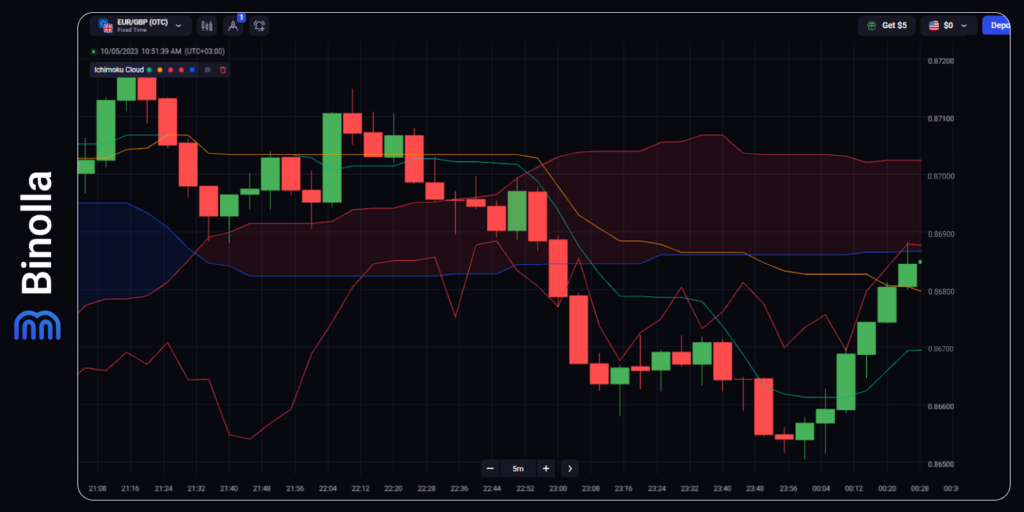
Now, let’s have a look at a totally different situation when the price leaves the Ichimoku Cloud from below. As you can see it on the chart above, the price penetrates the support level (the lower part of the Kumo cloud) and then moves lower.
The idea is to buy a Lower contract or sell a currency pair/stock once the breaking candlestick is closed. However, similar to the previous strategy, you can equally open trades at the moment of breakout, but you should be aware of the higher risks that you will take in this case.
Tenkan and Kijun Strategies
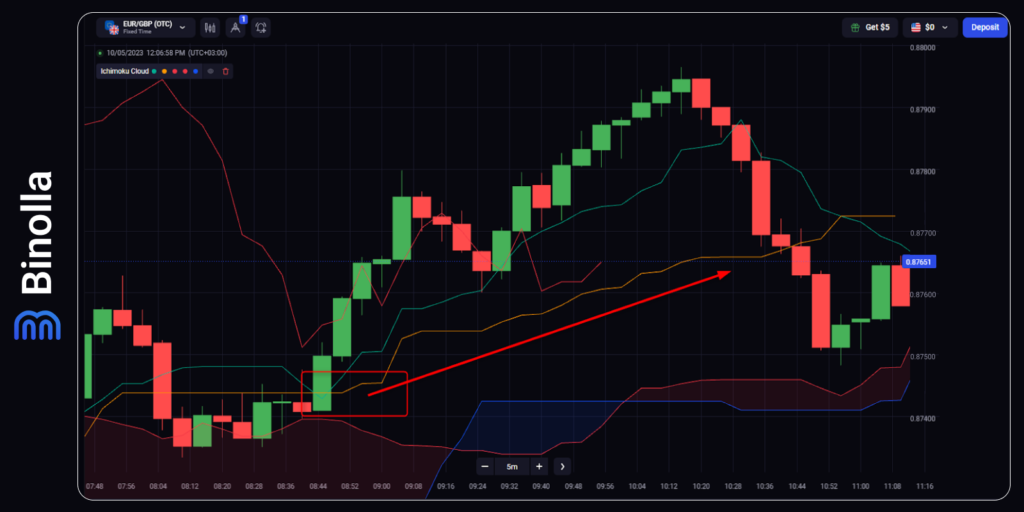
Kijun and Tenkan are both moving averages and this strategy works similarly to the MA crossover tactics. The idea here is to observe the charts and find the moment when both Tenkan and Kijun have a crossover and take a direction.
If the fast one is above the slow one and both move in the same direction, then you can buy a Higher contract or purchase a currency pair/stock. Moreover, as you can see it in our example, the price is above the Kumo cloud, which tells you that the uptrend is developing.
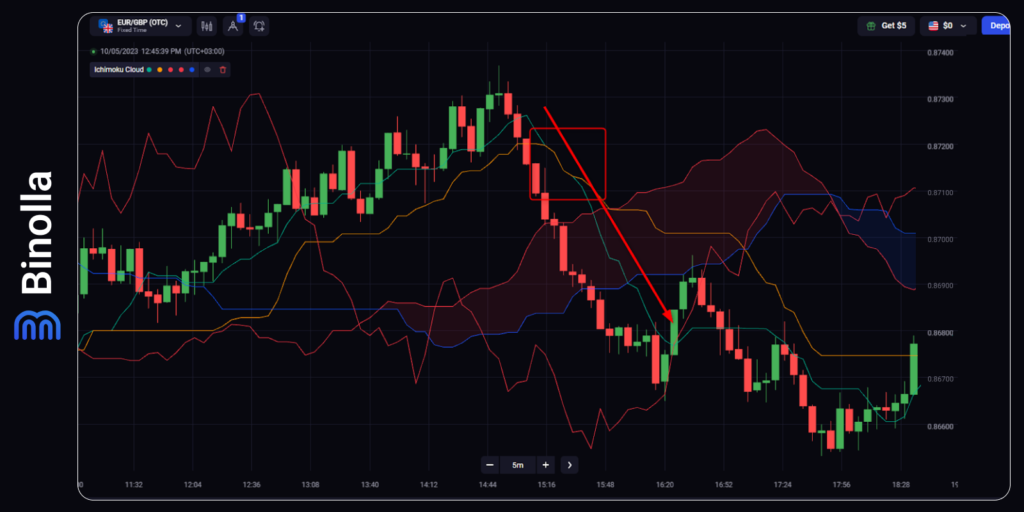
Another strategy that you can use with these lines is when the fast one is below the slow one. Similar to the MA Crossover tactics, here you can open Lower contracts or sell a currency pair/stock if both lines follow the downside direction.
In this particular case, you can see that the price starts above the Kumo cloud, which means that the uptrend was still in place, but later the price moved through the cloud and managed to penetrate through the lower band. Thus, you have a second signal here that you can use to add to your current position or buy another Lower contract if you are trading digital options.
Chikou Span Explained
The so-called “Delay Line” is mostly used by traders to define the strength of the current trend. Located above the price, it tells you that the uptrend is strong. However, if it goes below the price, the downtrend is gaining strength.
While it is almost useless when you look at it without considering other parts of the Ichimoku Cloud indicator, it can be very helpful, when you add Tenkan and Kijun strategy or even work the the could itself.
How to Place Stop Losses and When to Exit When Trading with Ichimoku Cloud?
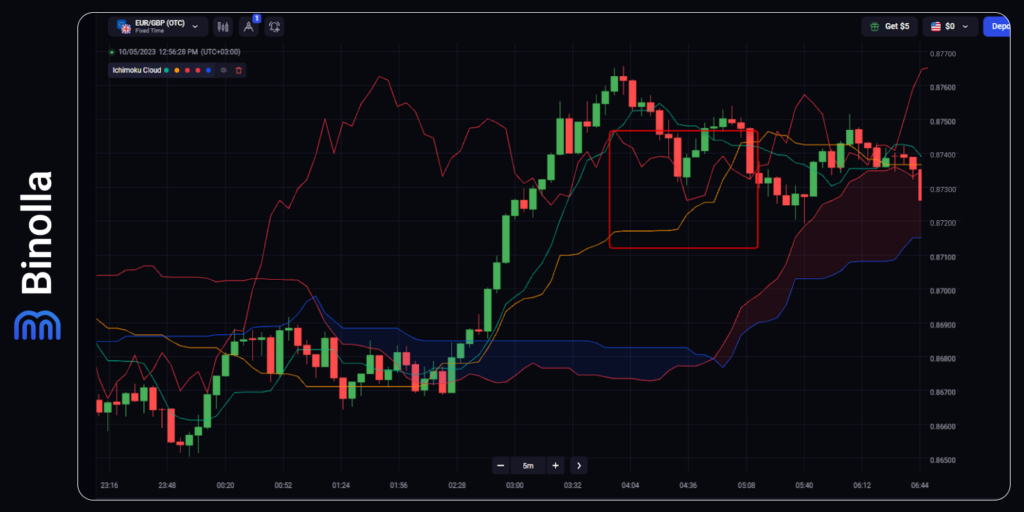
To exit from a trade, you can use various approaches. For instance, it would be a good idea to close your positions when both Kijun and Tenkan stop going upwards or downwards and become horizontal. It would be even more productive if both lines were intertwined with each other, which means that the trend is over.
In our example, the uptrend is over when both lines go sideways and later then have a crossover. It would be a good idea for a trader to close their positions when both moving averages go flat after moving upwards.
As for the stop loss, you can place it right below the Kumo cloud and move it following the price at some distance. Keep in mind that when you are trading digital options, no stop losses are required.
Pros and Cons of Using the Ichimoku Cloud Indicator
The indicator offers a lot of advantages that you can benefit from when using it. Find them below:
Ichimoku Cloud is an all-in-one out-of-the-box indicator that allows you to apply various both basic and complex strategies without even recoursing to other technical analysis systems;
It is suitable for all trading markets regardless of what exact financial instrument you use. With Ichimoku Cloud, you can trade both digital options and CFDs on various timeframes;
You don’t need to change any settings as it comes out of the box. However, if you think that you can even improve the indicator, you can adjust moving averages on your own;
With the Ichimoku Cloud indicator, you will have a very clear picture of what is happening on the market. You don’t need to combine various indicators to define the current market trend or to examine volatility.
Along with these advantages come some minor drawbacks:
Being a trend indicator, Ichimoku has a lag between the price and the lines. Therefore, you should consider it when opening your positions;
Ichimoku may seem a bit complicated for beginners. If so, we recommend switching to less complex systems such as Bollinger Bands or pure moving averages.
Key Recommendations for Using Ichimoku Cloud
When using the Ichimoku Cloud trading indicator, you can follow the recommendations listed below:
- Watch the position of the price as compared to the Ichimoku cloud. If it is above, you can assume the uptrend, while when it is below the cloud, the downtrend is developing. If the price stays within the cloud, the trend is neutral;
- Check Tenkan and Kijun moving averages to find entry points. If they are close to each other and intertwined, there is no clear trend in the market. However, if the distance between them is growing and they choose a particular direction, you can trade in this direction;
- Check volatility. The indicator can also be used to show your current market volatility. If the Chikou span is close to the price, then the volatility is low, while if there is a big distance between them, the volatility is high;
- Use signal confluences. When you buy a Higher digital contract or buy a currency pair/stock after the price breaks the upper band of the cloud, you can also check the position of the Kijun and Tenkan lines. If they go upwards and the faster one is above the slower one, then you have two signals telling you that the uptrend is going to continue.
Conclusion
The Ichimoku Cloud indicator is a great system that allows you to learn more about the current market state as well as to predict price fluctuations and get trading signals. It was designed by a Japanese trader Goichi Hosoda in the first half of the 20th century, but it is still relevant and many traders and even professional analysts use it for trading. Moreover, while it was designed to provide signals coming from Japanese assets, you can apply it for trading various financial instruments regardless of their issuers’ geographical position.
FAQ

How Accurate Ichimoku Cloud Is?
The indicator is accurate, but you should keep in mind that it is a lagging tool, which means that it follows the price and shows signals with a bit of a delay. Therefore, you should adjust your strategy to make the most out of it.
Should I Choose Settings When Trading with the Ichimoku Indicator?
No, you shouldn’t The basic settings are good for most types of assets. However, if you have an idea of how to make it perform even better, you can change periods of its moving averages.
Which Timeframe is the Best for Ichimoku?
While there is no difference in which timeframe you choose when trading with this indicator, it is better to apply it on higher intervals as they offer less market noise and pure price movements.
Can Ichimoku Be Used Alone?
Yes, you can use it alone as this is an all-in-one trading system that allows you to watch the current market state and even find entry points when the price goes in any direction.

