Fundamental Analysis vs. Technical Analysis: Which One Suits You Better?

Market analysis is an integral part of trading. Every successful trader tends to predict price fluctuations using various tools. They analyze incoming data as well as the price itself to make informed market decisions. There are two main types of analysis that market participants apply nowadays: fundamental and technical. By reading this article, you will learn more about the features of each one. Also, you will understand which one suits you better.
Ready to start trading in the financial markets? Join Binolla and choose from hundreds of different assets!
Contents
- 1 Key Takeaways
- 2 What Is Fundamental Analysis?
- 3 Example of Using Fundamental Analysis in Trading: How it Works
- 4 What Is Technical Analysis?
- 5 Key Differences Between Fundamental and Technical Analysis
- 6 Strengths and Weaknesses of Both Types of Analysis
- 7 When to Apply Fundamental and Technical Analysis
- 8 Start Using Fundamental and Technical Analysis!
- 9 Combination of Fundamental and Technical Analysis
- 10 Risks of Relying on One Analysis Method
- 11 Conclusion
- 12 FAQ
Key Takeaways
- Fundamental analysis provides you with information about the reason for a specific price movement.
- Technical analysis allows you to see trends and find entry/exit points.
- Both types of analysis have their own benefits and drawbacks.
- Traders can use them solely as they are independent.
- Combining technical and fundamental analysis may significantly improve your trading results.
What Is Fundamental Analysis?
Fundamental analysis is a study of various underlying economic factors that help traders and investors predict future major price trends. Apart from economic data, those who use this type of analysis should be informed about financial and political events as well as they may have both short-term and long-term effects on various assets.
The main goal of fundamental analysis is to determine whether an asset is going to rise or fall in the future based on external factors or its internal value. Unlike technical analysis, which focuses solely on the price, fundamental analysis allows traders and investors to dive deeper into factors that go beyond the quotes.
Key Aspects to Consider When Trading with Fundamental Analysis
- Macroeconomic indicators. Market participants use various macroeconomic indicators, including economic growth data, inflation, labor market stats, and trade balance information, to understand how healthy the economy is. This information can be found in any economic calendar.
- Business performance. Those who trade stocks or indices should also focus on companies’ data, including revenue growth, earnings per share, debt, profit margins, and other parameters to predict future price fluctuations. To find such information, you can visit companies’ websites.
- Central bank moves. Central banks are responsible for the financial part of the economic prosperity of a particular country. They can use various monetary policy tools, such as interest rate cuts or hikes, as well as quantitative easing programs, to stimulate economic growth or curb inflation. This data is available in economic calendars and central banks’ official websites.
- News and events. Traders and investors should check the current global and regional context, which may include political instability, wars, natural disasters, and developments when they conduct fundamental analysis. You can find information about news and events in major media, including Bloomberg, Reuters, etc.
Example of Using Fundamental Analysis in Trading: How it Works
First, let’s see how fundamental analysis works. Here is a detailed guide on how to use fundamental analysis in practice in Forex:
- Choose an asset that you are going to trade. This can be a currency pair, stock, index, cryptocurrency, or any other.
- Go through the news to see the fundamental background. Read what analysts think about the current state of the asset, whether it is undervalued or overvalued, etc.
- Check any economic calendar for the past and upcoming data releases. For instance, if the inflation data is above expectations and growing inflation is a major concern for a central bank, you can buy a currency as there is a probability that the officials will at least leave the interest rate unchanged.
- Monitor the central bank’s policy. Before making any decision based on the fundamental analysis, you should also check the recent comments and moves from central bankers. Knowing the direction will help you better plan your mid and long-term trades.
- Check non-economic factors. It is not a secret that all the assets may be influenced by politics and geopolitics. In case of wars, disasters, riots, and other events, markets will react immediately. Some of these events can be foreseen in advance.
- Analyze all the incoming data from previous steps to develop your own fundamental bias. For instance, if a central bank plans to stick to the wait-and-see approach instead of stimulating the economy by cutting the rate, and inflation goes above expectations, then you can assume that a currency will appreciate over time.
- Go to the chart. Now it’s time to delve into the chart and watch the current trend as well as find entry points. You can place a trade right away or wait for the upcoming swing to be more precise.
- Place a trade. Buy or sell the asset according to your market perception. Place stop loss and take profit orders to mitigate your risks and automate your trading routine.
As an example of fundamental analysis in practice, let’s take EUR/USD. A trader follows the latest ECB developments and finds out that the central bank is going to cut rates due to weak economic growth and low inflation. The Fed, on the other hand, is preoccupied with higher inflation and sticks to the wait-and-see approach, which means that the central bankers are unlikely to vote for the rate cut in the near future. The EUR/USD currency pair is likely to plunge in this case as the euro will weaken against its overseas counterpart. Therefore, a trader can sell the currency pair.
Another example will come from the world of cryptos. Imagine that the Ethereum blockchain prepares a major update that is going to increase the transaction speed and lower commissions. ETH/USD is likely to surge in this case as the number of transactions and interest in the blockchain is likely to rise.
When it comes to commodities, the recent Middle East conflict stimulated the price growth in oil and gold. The first surged amid fears of oil supply chain disruptions (Iran threatened to close the Strait of Hormuz), while the precious metal gained support as it is considered a safe haven asset.
However, this positive correlation is not the rule. When it comes to current trade wars, any negative news about new tariffs will support the gold while putting pressure on oil.
What Is Technical Analysis?
Technical analysis allows market participants to predict price fluctuations based on charts and volume. Traders using it do not focus on external factors. They don’t need to understand why the price is moving in a particular direction. Market participants focus solely on the price action or technical indicators to forecast price fluctuations. They believe that all the external information is already included in the price.
Key Technical Analysis Tools
- Charts. Traders use various types of charts, including line, bar, and Japanese candlesticks, to predict price fluctuations.
- Patterns. Market participants try to find various patterns to visualize market activity. They may include flags, head and shoulders, triangles, and others to find entry points.
- Technical indicators. These tools help market participants understand the market context and when to enter or exit the market. The most popular include moving averages, Bollinger Bands, RSI, and others.
- Drawing tools. Traders and investors often use support and resistance levels, trend lines, Fibonacci retracement, and other drawing tools to capitalize on price fluctuations.
All these tools are available on the Binolla platform. The trading terminal allows you to choose from the most popular chart types, drawing tools, and indicators (over 50, including the most popular classic indicators, like RSI, BB, Stochastic, moving average, and others).

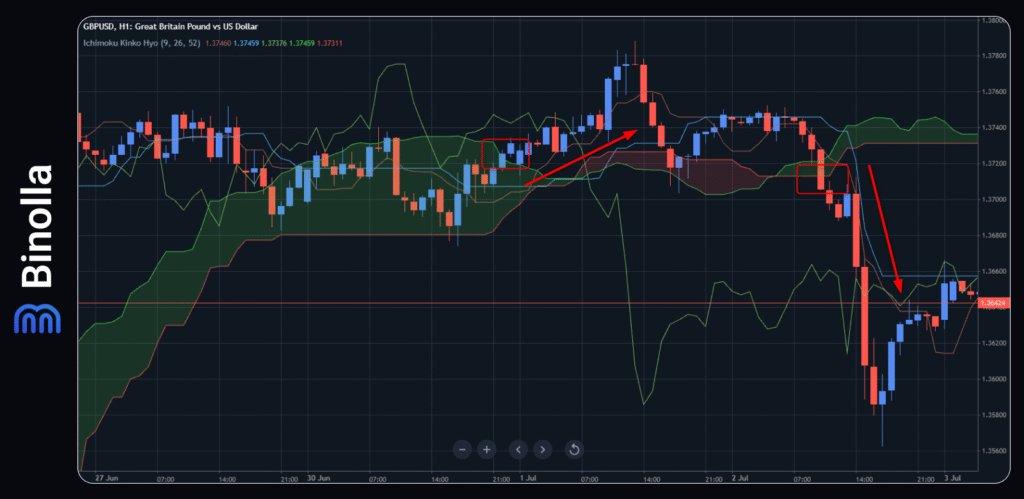
Traders can use various technical indicators to predict price fluctuations. In this particular case, we can see that the quotes move above and below the Ichimoku cloud. The latter allows market participants to understand which side, buyers or sellers, is dominating the market currently. If the buyers control the market, then once the price moves above the Ichimoku Cloud, you can search for long positions. When the quotes start to plunge, then you can see that the market sentiment is changing, and sellers become the dominant side of the market.
Key Differences Between Fundamental and Technical Analysis
Both types of analysis aim to help market participants make informed decisions. However, they have different principles behind them and can be applied to different strategies. In this table, you can see the key distinctions between the two.
| Aspect | Fundamental Analysis | Technical Analysis |
| Main factors and tools | Economic data, financial reports, news, and blockchain updates | Price action, chart patterns, indicators |
| Time Horizon | Long-term (weeks to years) | Short to medium-term (minutes to days or weeks) |
| Tools | Economic calendars, earnings reports, on-chain metrics | Candlestick charts, moving averages, RSI, MACD |
| Decision Basis | Asset’s intrinsic value or macroeconomic direction | Historical price behavior and statistical patterns |
| Preferred Markets | Stocks, Forex, Crypto (long-term investing) | All markets (especially popular in Forex and Crypto trading) |
| Best For | Investors, position traders, macro analysts | Day traders, scalpers, swing traders |
| Reactions to News | Reacts to news and data events over time | Often anticipates or immediately responds to news via price |
| Timing Precision | Low (more strategic, less focused on entry points) | High (precise entries and exits based on price signals) |
Strengths and Weaknesses of Both Types of Analysis
Both types of analysis provide traders with powerful insights about current and future price fluctuations. Each has its own benefits and drawbacks. Let’s compare them.
| Factor | Fundamental Analysis | Technical Analysis |
| Advantages | Identifies the intrinsic value of assets | Excellent for timing entries and exits |
| Long-term perspective based on real-world data | Works on all assets and timeframes (stocks, crypto, forex, etc.) | |
| Useful for strategic investment planning | Faster decision-making based on real-time price movements | |
| Less impacted by short-term market noise | Visual and pattern-based; easier to learn for many beginners | |
| Weaknesses | Doesn’t help with short-term timing | Ignores macroeconomic and fundamental data |
| Slow to respond to sudden price changes | Risk of false signals, especially in sideways or low-volume markets | |
| Requires an understanding of economics or company data | Relies heavily on discipline and emotional control | |
| Not ideal for day trading or scalping | Some patterns may be subjective or overly dependent on trader interpretation |
When to Apply Fundamental and Technical Analysis
Choosing between fundamental and technical analysis entirely depends on your knowledge as well as your trading goals. If you prefer long-term trading, then fundamental analysis will definitely be your pick. However, you should be prepared to follow the news and the latest data releases to be aware of the market context.
When trading with fundamental analysis, you should also be prepared to switch to higher timeframes. The best option is daily or even weekly timeframes which will allow you to have a broader scope of major trends. Also, you should understand that in order to capitalize on price fluctuations, you will have to be ready to hold your positions for longer.
When it comes to technical analysis, you can use all types of timeframes, and your choice depends entirely on your trading goals. If you are a scalper or a day trader, you can switch to minute or hourly charts, while swing traders can also use daily or weekly timeframes. Moreover, technical analysis traders sometimes use more than one timeframe to see major trends and then switch to lower timeframes to step in.
When it comes to Forex and crypto, these are fast-moving markets, which means that you can apply technical analysis to catch even minor price movements. By using patterns and indicators, you will be on time to make market decisions.
It should be mentioned that fundamental analysis is especially useful when it comes to times of decision-making. For instance, when a central bank cuts or hikes rates or makes a statement that can be considered dovish or hawkish. Once this happens, market participants can have a deep insight into major trends and drivers and align their decisions with the market’s main direction.
Swing and position traders can combine both analysis types to improve their performance. They use fundamentals to understand the market sentiment, while they apply various swing trading strategies to see where to enter the market.
Combination of Fundamental and Technical Analysis

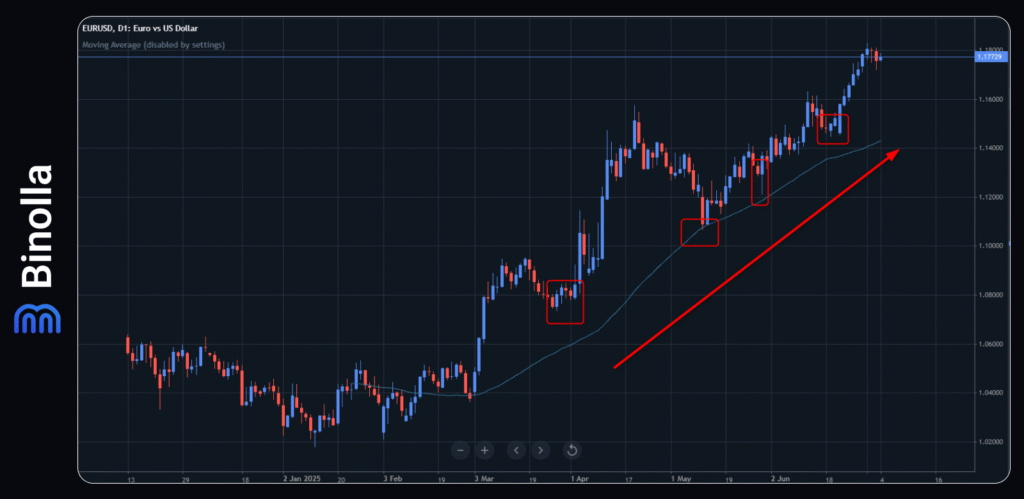
It was already mentioned that traders can combine fundamental and technical analysis to improve their trading results. The recent example comes from the EUR/USD pair, which began to rise in March as the market sentiment shifted towards the euro. Donald Trump threatened the whole world with his devastating tariffs, which were likely to strike both US and overseas economies.
Moreover, economic stagnation iт the US may lead to more aggressive rate cuts by the Fed, which also supports the currency pair. Knowing this, the only thing that you need to do is to switch to higher timeframes and outline the uptrend.
Once the price approaches the moving average, you can buy from there. However, you should keep in mind that a switch in market sentiment may come if fundamentals change.
Risks of Relying on One Analysis Method
Both analysis types have their strengths and they can be used independently. However, combining them may significantly improve your results. Those who rely on fundamental analysis solely, risk missing short-term reversals. Short-term swings may lead to significant losses or drawbacks, especially if you buy at the top before the correction begins or sell at the bottom.
Those who use technical analysis risk overlooking major news and missing major trends. Moreover, there is also a risk of trading patterns that may break even without any visual problem in them. It should be mentioned that sometimes even the most reliable patterns fail due to sharply changing market sentiment.
No analysis method can guarantee you 100% success. Therefore, to improve your chances, you can combine both types of analysis to make each of your trades even more confident. Moreover, effective risk management can provide you with more confidence in whatever asset you choose for trading.
Conclusion
Both analysis types offer valuable insight into the financial markets. While fundamental analysis tells you about the reasons for a particular price movement, technical analysis allows you to understand the price action and find entry and exit points. Choosing one depends entirely on your trading style. If you want quick profits, then you can focus on technical analysis. However, you should prepare to tackle the market noise. For those looking for more consistent long-term results, fundamental analysis may be a better choice. A lot of professional traders combine both types of analysis to improve their chances. They grasp both market sentiment and current price action to make even more informed decisions.
FAQ

Can I Use Both Fundamental and Technical Analysis Together?
Yes, you can. When combining both types of market analysis, you can be more sure about the upcoming market movements and major trends. This will help you better understand the market context and make more informed decisions.
Which Analysis is Better for Beginners?
Technical analysis is better for beginners as they can master only one tool and start making money. However, trading is a never-ending learning process and it is recommended to grasp fundamental analysis as well.
Is Technical Analysis Reliable for Long-Term Trading?
Yes, sure. Technical analysis can be applied to different trading strategies and styles, including long-term position trading.
What Markets Are Best Suited for Fundamental Analysis?
All markets are suitable for fundamental analysis. Macroeconomic news and political events have an impact on all assets.
Can I Use Technical Indicators on Various Timeframes?
Yes, you can use technical indicators on various timeframes from seconds to months.


