Confluence in Trading: How to Combine Signals to Improve Your Trading Results

Traders often use sophisticated strategies to improve their performance. Instead of applying one indicator or candlestick pattern, they add additional tools to confirm signals and, thus, improve their chances of profiting. By reading this article, you will learn more about confluence in trading and how to use a combination of different signals to make your perfect trades.
Looking for a reliable broker for trading? Join Binolla now and place your trades on the best trading platform for digital options and Forex CFDs!
Contents
Key Takeaways
- Confluence combines various signals that support the same trading idea.
- By using more than one tool, traders can improve their results.
- Traders can use various indicators, as well as the same indicators with different settings.
- Confluence reduces risks by improving the accuracy of your signals.
- By seeking to confirm your trading signals, you can become overconfident and biased.
- Traders should use confluence to trade more confidently.
Confluence Basics
Confluence in trading is a strategic alignment of two or more factors that point in the same direction. This approach can be applied to both entry and exit points, which makes confluence a universal method in trading. Rather than relying on a single signal, traders look for several pieces of evidence of a trend continuation or reversal and make their decisions based on this information. The more elements tell you that a market can go in the same direction or make a reversal, the better.
Confluence can be compared to an investigation. The more facts you have, the more sure you are about the case. While there is still no 100% guarantee of positive results even with a reliable strategy, confluence helps traders improve their odds and gives them confidence about what they should do in the market.
Types of Confluence in Trading
Many traders believe that confluence in trading is related to using several technical indicators. However, this method is broader than simply relying on such tools. Many professionals go beyond using technical indicators, and they apply confluence even when they use Japanese candlestick patterns together with drawing tools and other types of patterns. Here are the main types of confluence in trading.
A combination of Technical Indicators
Traders can apply an indicator with different settings to find confluences and confirm trading signals. For instance, if you are familiar with Alligator by Bill Williams, this technical analysis tool is built on this idea.
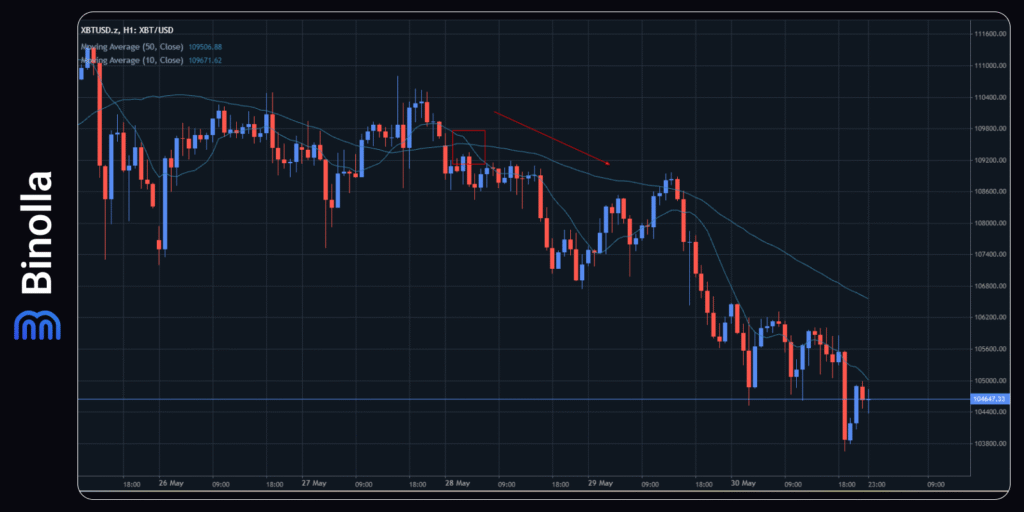
Let’s consider the following situation. We have two MAs with a period of 10 and 50. The first one is a more flexible moving average, which reacts to minor price fluctuations, while the second one, with a longer period, is used to outline medium-term trends.
What does this confluence give to a trader? After receiving a trading signal (MA crossover), when the shorter MA breaks the longer one from above, you can see that the longer moving average demonstrates the continuation of the downtrend. Therefore, traders can sell and hold until the opposite crossover occurs (the shorter MA will break the longer and move higher).
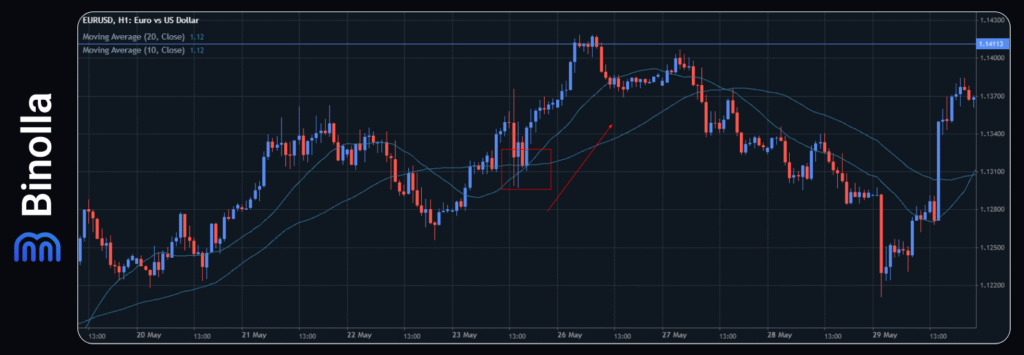
The same is relevant for situations when both lines cross below the price. This confluence allows you to find a signal to go long when the crossover occurs. Similar to the previous case, you can buy and hold the position until the opposite signal takes place.
Another subtype of indicator confluence occurs when you use indicators of the same type of action. This means that you can apply, for instance, a moving average and Bollinger Bands, which both belong to the trend-following category.
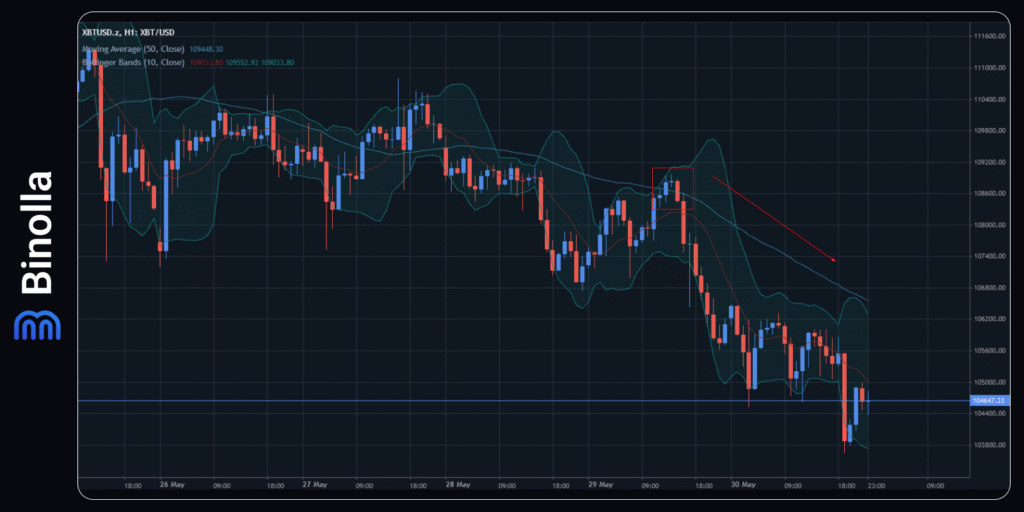
The next example demonstrates how a trader can use the moving average of 50 and the Bollinger Bands indicator together. The price reaches the higher band of the Bollinger Bands indicator and reverses from there. Next, the price breaks below the SMA50 before continuing its decline. This confluence tells you that the local trend has changed and the price is likely to continue its downside movement.
What is important here is that the two signals are not coming simultaneously. The first appears when the price hits the upper band and reverses from there, the second is a kind of confirmation when the price breaks below the SMA50.
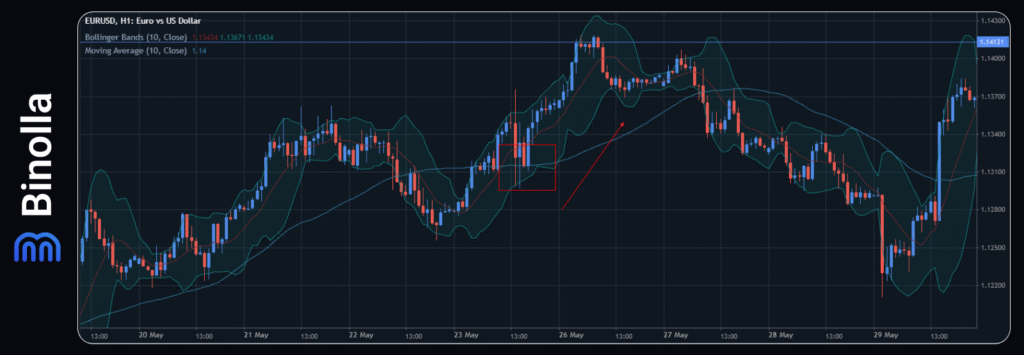
In this example, you can buy an asset when the price reaches the lower band of the Bollinger Bands indicator and tests the moving average. You can place an order when the candlestick that tests the SMA50 and the lower band of the indicator is closed.
Keep in mind that you should use confluence wisely. Applying several indicators of the same type can be very useful, but it also can be confusing if a trader does it randomly, without a clear idea of why they apply a specific tool.
Finally, market participants can use technical indicators with different types of action to find confluences and confirm signals. For instance, they can combine oscillators and trend-following indicators to improve their chances of profiting.
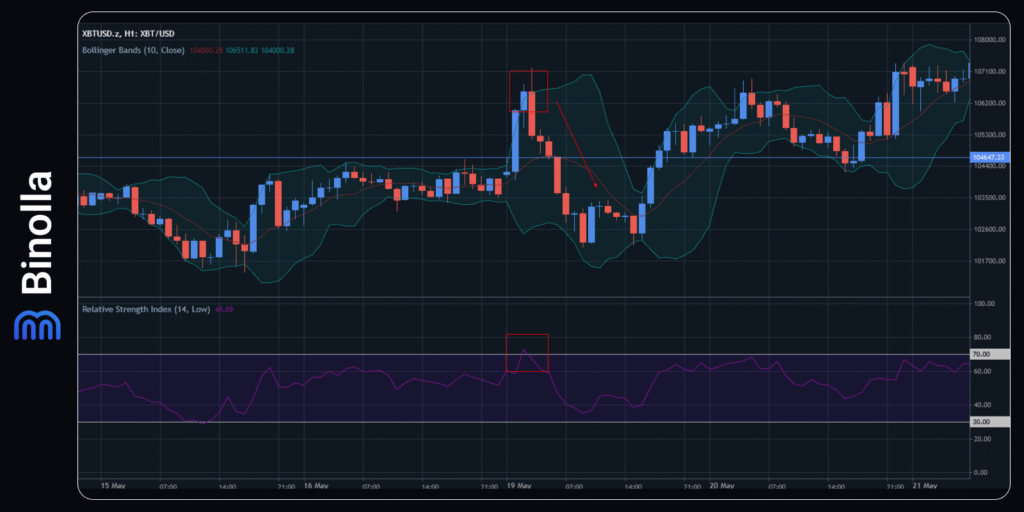
The next example illustrates how a trader can use a famous oscillator together with Bollinger Bands. The RSI indicator goes into the overbought area for a while, and then the line goes below 70 again. This is a reversal signal indicating a correction or a full-fledged market reversal. To be more sure about the upcoming market movement, a trader can use Bollinger Bands.
In this particular case, the price hits the upper band and reverses after a bearish engulfing appears on the chart. This confluence tells a trader that a downside reversal is possible. Market participants can sell in this situation.
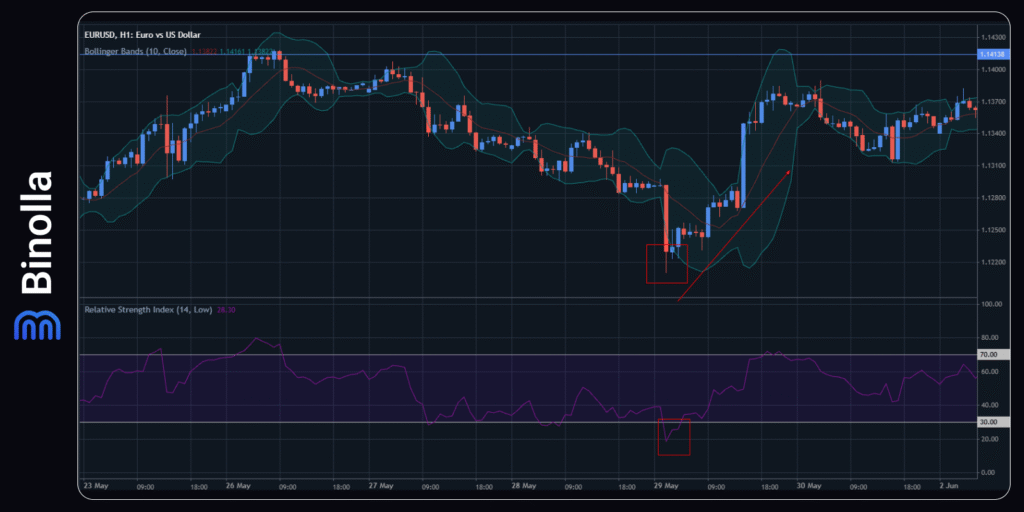
In this example, the price tests the lower band of the Bollinger Bands indicator while the RSI is leaving the oversold area. You can buy when the candlestick above the lower band closes and the RSI line is above 30 again.
Combining Technical Indicators and Patterns
Another type of confluence is based on a combination of technical indicators and patterns. A good example of such an approach is to use technical analysis tools like Alligator and various Japanese candlestick patterns.
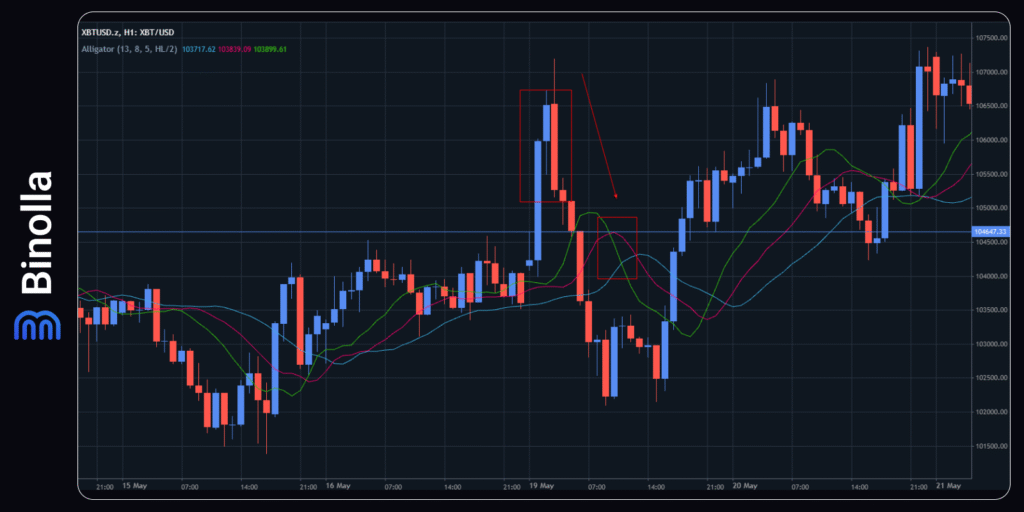
The image above shows how a trader can find reversals using Alligator and reversal patterns. Keep in mind that Alligator is a lagging indicator, therefore, its signals will come a bit later after a reversal candlestick pattern.
Therefore, first, you need to check whether a reversal candlestick pattern appears. In our example, we have a bearish engulfing (where the bearish candlestick engulfs the bullish one at the resistance level).
Next comes Alligator. All three lines cross with each other and change their direction from upward to downward. The confirmation comes from the indicator, and a trader can sell.
In another example, we combine trading patterns with the Stochastic oscillator. The idea is the same – to find a confirmation of a reversal signal with the famous technical indicator.
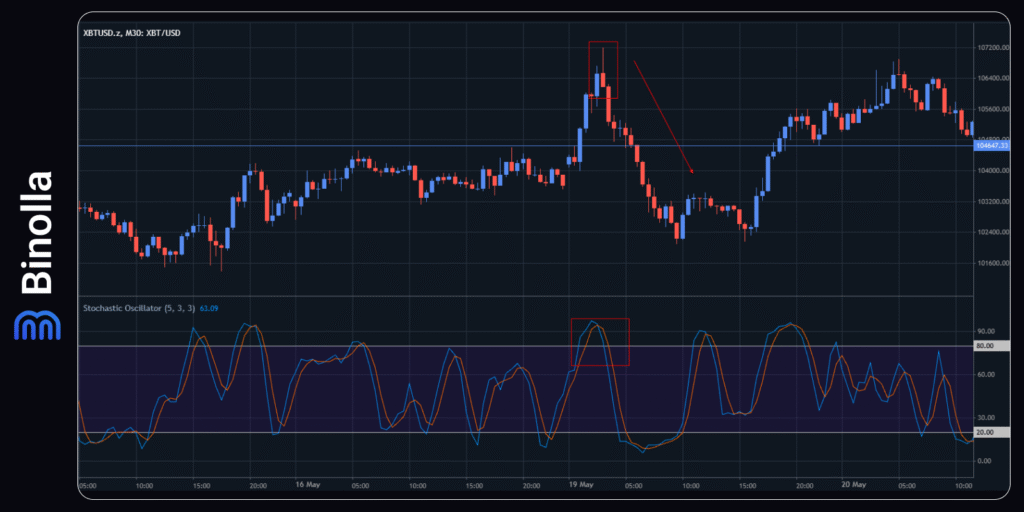
Here you can see that a candlestick reversal pattern (shooting star) appears. Instead of simply using it to find a reversal, you can also add the Stochastic indicator. As you can see now, Stochastic crosses the 80 level from above, which means that it leaves the overbought area. Both signals tell you that we have a downside reversal, which is clearly seen on the chart.
When using Stochastic, you can get a signal even earlier, when the two lines of the indicator cross with each other. This happens at the top of the indicator window, and from this moment, you can wait for a reversal. Once the shooting star appears and Stochastic moves below 80, you can sell.
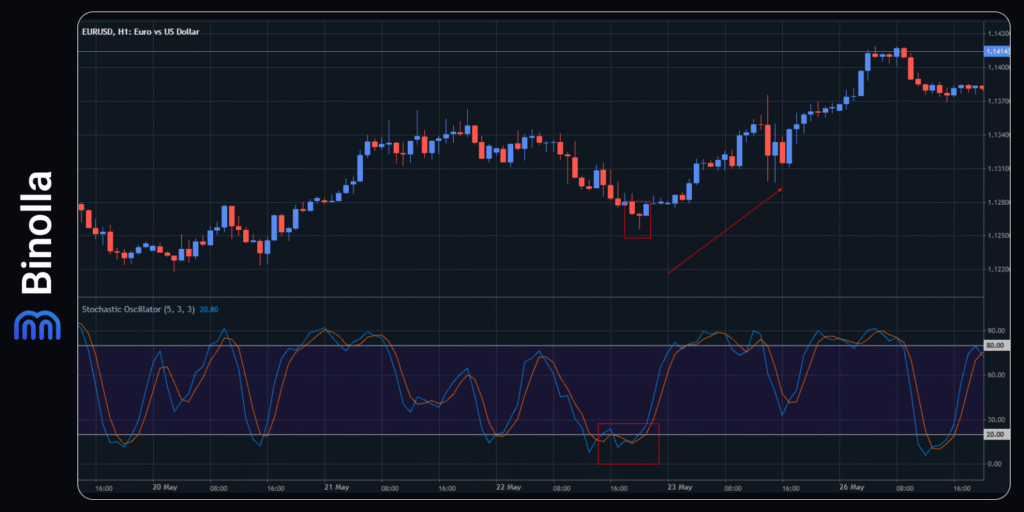
When the stochastic is in the oversold position, you can prepare to buy. However, place an order only when a candlestick pattern appears. In this case, you can place an order when the hammer candlestick closes.
Combining Technical and Fundamental Analysis
Traders often combine the two types of analysis to get better results. They search for the key market drivers first and then look at charts to find confirmation. For instance, if there is an inflation report in the economic calendar, then you can expect higher volatility and trade on it. If the inflation data is higher than expected, then the currency price is likely to rise, and you can switch to charts to see signals confirming the beginning or the continuation of the uptrend.
Keep in mind that this method requires an understanding of fundamental analysis and how various fundamental indicators and other events can influence the market.
Why Confluence Matters
Whatever technical or fundamental analysis tool you use, relying on a single indicator or pattern may result in negative outcomes. Traders often search for confirmations to be more sure about their decisions. This is where confluence comes into play. Here are the main reasons for using it in your trading sessions:
- Confluence improves accuracy. Each setup that you find on the chart becomes stronger when confirmed with other technical analysis tools.
- This method helps filter out false signals. When using a single indicator, you risk having false signals. By adding another indicator or using another technical analysis method, such as patterns or Japanese candlestick signals, you can reduce the risk of being wrong when opening your next trade.
- Using confluence builds confidence. When trading more than one analysis tool, you can be more sure about what you do. This, in turn, helps you build confidence and improve your psychological state during trading.
- This method allows you to better control your risks in trading. By using confluence, you can place stop loss and take profit orders with greater accuracy. Therefore, you can improve your risk and money management tactics when combining different technical analysis tools.
- Confluence helps traders become more disciplined. When using confluence in trading, market participants work on their patience as they need to wait for confirmations before opening the next trade. Therefore, they learn to become more disciplined.
Risks of Using Confluence in Trading
While confluence seems to be an ideal method for trading, some risks still exist. Here are some of the most evident ones that you should try to avoid:
- Overanalysis. Confluence may lead to a situation where traders wait for too long for signals and miss true trading opportunities. Looking for perfect signals may result in inactivity and even paralyze traders. Remember that the idea of trading is to make money and not to make perfect entries.
- Overconfidence. When seeking to be more confident, you shouldn’t become overconfident. Even if all indicators show that the signal is strong, you should never forget about money and risk management, as the situation may change drastically, and you should be prepared for every outcome.
- Subjectivity. When looking for confirmation, you can become too subjective. Instead of finding confluence, you may see confluence where there is nothing. This may lead to false signals and false confirmations.
- Late entries. Confluence requires time, and not all technical analysis tools allow you to see market changes in advance. If you are waiting for confirmation for too long, you may miss the opportunity, and the price will make a substantial move until you join the market.
Conclusion
Confluence is a very popular and reliable method that many traders use in their trading sessions. It allows you to get additional confirmation of trading signals by adding more indicators or drawing tools. Confluence can provide you with more precise signals coming from different technical analysis tools or macroeconomic indicators. While it can be considered a perfect method, it has both advantages and risks, which you should consider before using it. However, in any case, having an additional confirmation may be very helpful when it comes to trading.
FAQ

What Is Confluence in Trading?
Confluence refers to using a combination of multiple technical indicators and signals that align to support a specific trading idea. For instance, if you have a reversal pattern and you see that RSI leaves the overbought area, you can be more sure about the upcoming reversal.
Why Is Confluence Important in Trading?
Confluence gives you more confidence about your trading decisions. If more than one indicator points to a reversal, then you can be more confident about what you are going to do.
What Combinations Can Create Confluence?
Various sets of tools can demonstrate confluence. For example, you can use momentum indicators and support and resistance levels to find reversals or corrections. Also, you can use various patterns with drawing tools for confirmation.
How to Manage Risks When Using Confluence?
You can use the same money and risk management rules when finding confluences. For instance, if you are going to sell, set stop losses above the resistance level and target the next support areas.
Can Confluence Fail in Trading?
Yes, sure. Confluence only improves your chances, but none of the methods provides a 100% guarantee. In times of important news or data releases, even the strongest signals can be broken.


