A Complete Guide to Digital Options and Forex Indicators

Indicators are among the most popular technical analysis tools. They allow digital options, Forex, and stock traders to find entry points, visualize current market volatility, follow trends, and even see market reversals. Indicators are very illustrative, as they normally smooth market fluctuations and present main tendencies in a very convenient way. By reading this article, you will learn more about digital options and Forex indicators and their main features.
Contents
- 1 What Are Trading Indicators?
- 2 How Do They Work?
- 3 Types of Technical Indicators
- 4 Practice trading with these indicators!
- 5 What Technical Indicator to Learn First?
- 6 How Many Indicators to Apply to the Chart?
- 7 Top Forex Indicators for Digital Options
- 8 Technical Indicators for Digital Options: Tips and Tricks
- 9 Technical Indicators: Pros and Cons
- 10 Conclusion
- 11 FAQ
What Are Trading Indicators?
Technical indicators refer to mathematical calculations. Depending on their formula, they can underline current market trends or even find momentum. Some indicators can even define the strength of the trend without defining its direction.
This is the basic principle that you should be aware of. Indicators have nothing to do with magic and miracles. Even if they seem to be miracles once applied to the chart, they are based on math calculations. Use various indicators with Binolla by opening an account there.
How Do They Work?
While there are plenty of various indicators, and they are mainly based on different formulas, the basic idea behind them is the same. If you take any of the top five indicators, they have a similar idea as they calculate the average price and draw a line (or several lines).
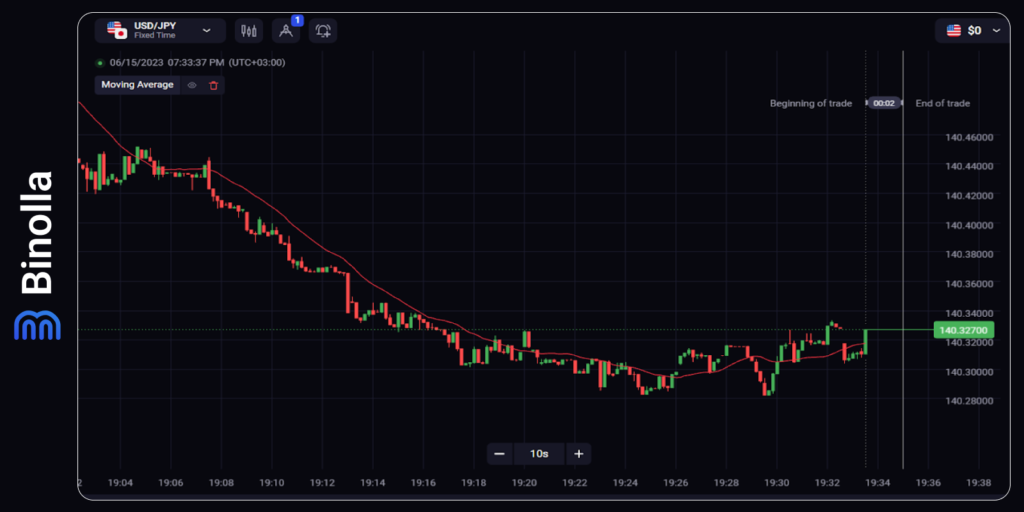
Indicators can be used to define current trends. For instance, if you take a pure moving average, you can see the price movement direction. This, in turn, allows you to work along the trend and increase your chances of buying profitable contracts or buying/selling Forex CFDs more precisely.
Technical indicators are purely data-driven and they are easier to understand than drawing tools or Japanese candlesticks. Moreover, you don’t need any special knowledge when applying them, as they are drawn automatically on the charts. The only thing that is required of you is to set a period, deviation, or any other option that is available in the indicators’ settings.
All the changes to the indicators on the charts are done automatically. Since they are all based on formulas, you don’t need to adjust anything manually. Once the price changes, the indicator is recalculated again, and you see the line or histogram changing.
Types of Technical Indicators
There are four main types of technical indicators that are categorized according to their purposes.
Trend Indicators
As it comes from its name, this type of technical indicator is based on the idea of trend. They are also known as trend-following tools, which means that they follow the current market trend, allowing traders to see the price direction.
Along with their primary purpose, those indicators can also be used as a strategy that allows traders to find entry points. Keep in mind that digital options traders use them rarely for trend-defining as trends, in general, are not among their priorities.
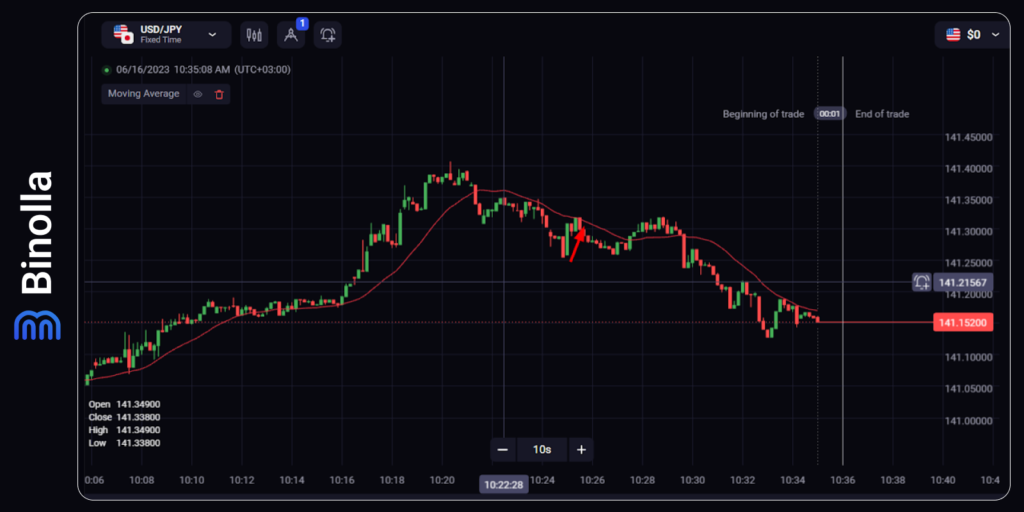
The example above shows that you can buy a Higher contract even when there is a general downtrend. Therefore, you don’t need to define the current tendency; in general, you simply need to find reliable entry points.
When it comes to Forex, you can discover current trends and buy or sell assets according to the main price direction.
Example of a Trend Indicator
One of the most popular trend indicators is the moving average. It is based on the concept of calculating the average price for each period (candlestick). Those average prices are connected with lines, which gives you a smooth line defining the current trend.
Basically, if the trend line is above the price and is declining, you can assume that there is a downtrend. On the other hand, if the moving average is below the price, traders can assume that there is an uptrend.
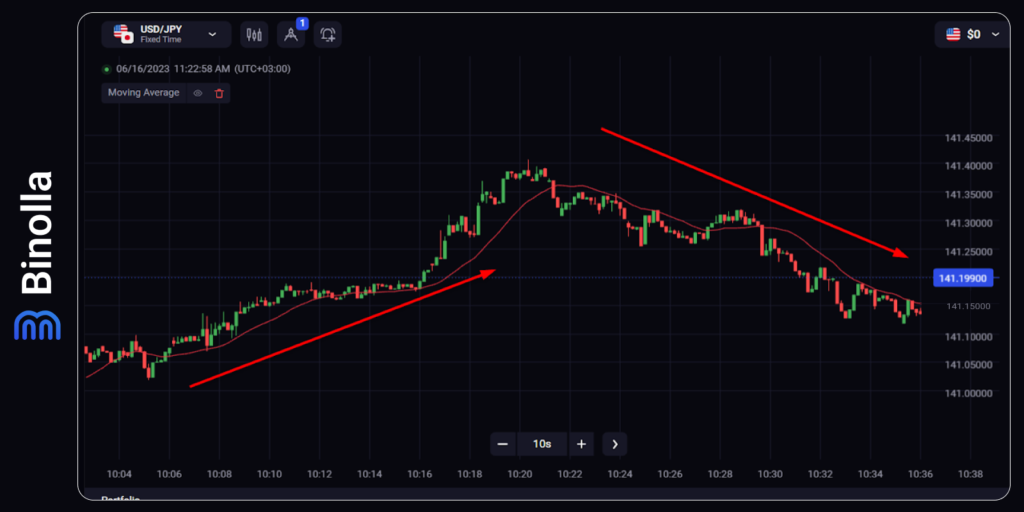
The example above demonstrates two separate trends that are highlighted by the moving average.
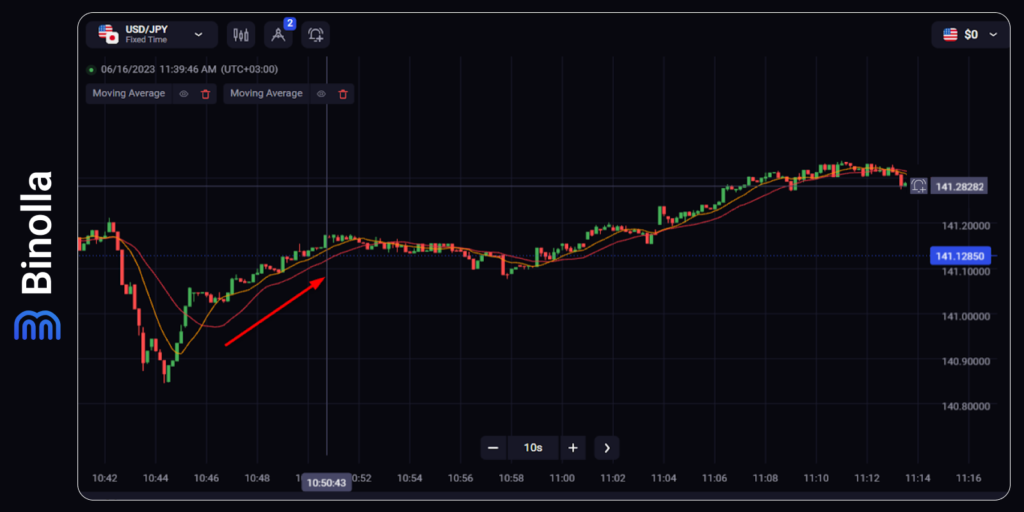
The simplest strategy that you can use when applying two moving averages is the MA crossover. As you can see, this is a very simple strategy where you can use two MAs of different periods. As the crossover occurred below the price, you can buy a Higher contract or buy the currency pair if you are trading Forex CFDs.
When trading with trend indicators, you should keep in mind that they have one major drawback. Those indicators are trend “following.” Therefore, they do not tell you about the current market situation in advance. You will find out about the trend or even find a reversal signal postfactum.
Momentum Indicators
Those are oscillating indicators that allow you to find market reversals and entry points. Most oscillators are based on oversold and overbought ideas. This concept is very simple. If the asset is oversold, you can assume that the price is going to reverse and go upward in the near future. On the other hand, if the asset is overbought, the price is likely to change direction downward.
Example of a Momentum Indicator
A good example of a momentum indicator is the RSI, or Relative Strength Index. it allows you to predict price reversals and build your strategy around this concept. RSI is popular among both digital options and Forex CFD traders as it is 100% applicable in most market situations.
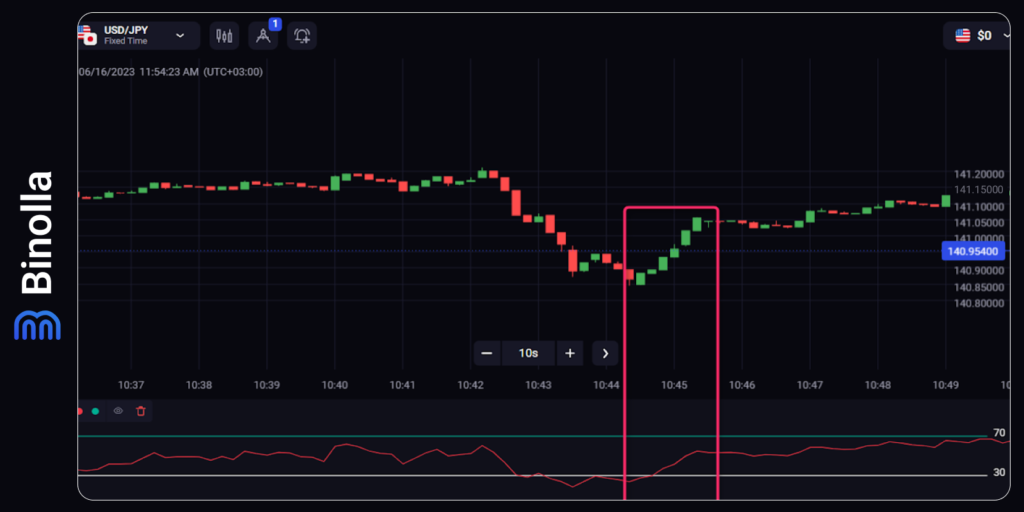
The example above shows a very simple strategy that you can use when trading with RSI. Once the indicator line leaves the oversold area (below 30), you can expect the price to move upward. Therefore, it would be a good idea to buy a Higher contract or a Forex currency pair.
Volatility and Trend Strenght Indicators
Volatility is very important in trading whatever asset you choose. Therefore, knowing the current volatility is crucial for success. Any dramatic change in the market is likely to provide traders with some great opportunities.
While volatility itself does not provide any signals to traders, it is commonly used by traders to understand which assets to trade and how many pips a price can make in a particular interval.
Example of a Volatility Indicator
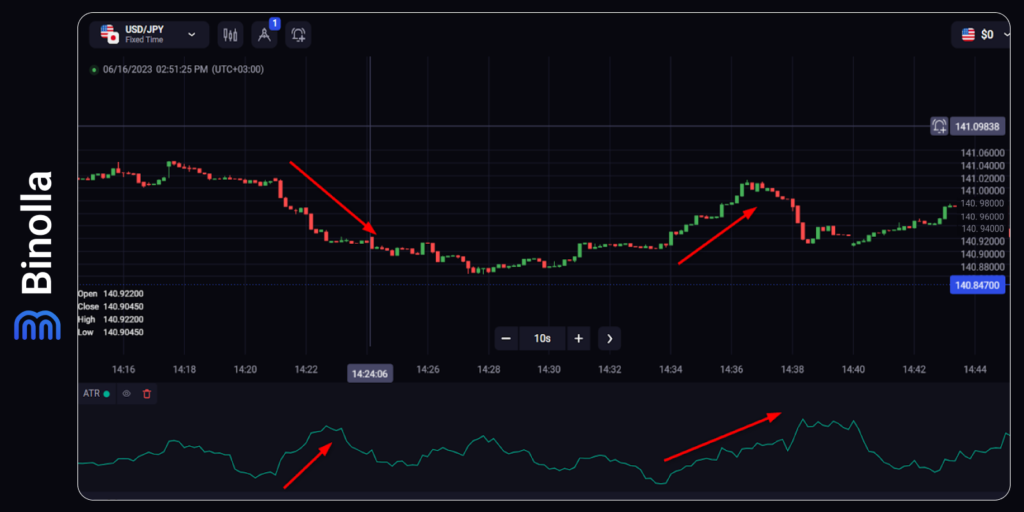
One of the most interesting volatility indicators is ATR or Average True Range. The idea behind this indicator is to demonstrate current market volatility and the strength of the current trend. As you can see on the chart above, while the ATR is growing, we have a rise in volatility and a trend movement.
However, you shouldn’t forget that the position of the ATR line as well as its slope have nothing to do with the trend direction. It can grow regardless of the current trend, as this uptrend in the ATR line demonstrates the rising volatility and the growing strength of the trend, not its direction.
Pure ATR is useless as an indicator to find entry points. Moreover, digital options traders can skip it as well and not add the indicator to their strategies as they are not interested in the direction or strength of the trend. Even one pip counts. Therefore, even if the market is less volatile at any particular moment, you still have an opportunity to earn a payout.
Forex traders never use ATR as a separate indicator as it is less informative.
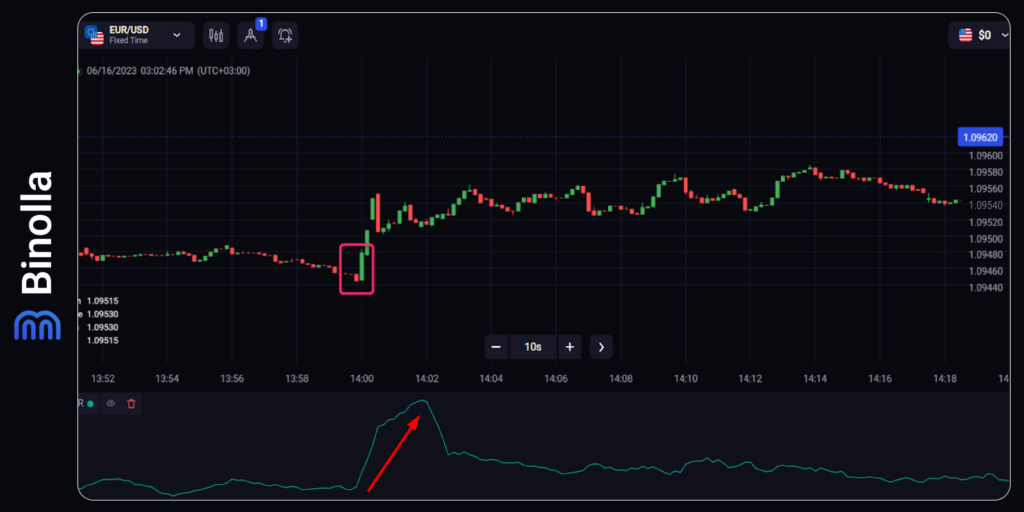
In the example above, you can see Bullish Engulfing. This is an opportunity for a trader to buy the currency pair. You can hold the position until ATR grows, as you can expect that the volatility will remain high.
Volume Indicators
This fourth category of indicators is here for informational purposes only. The point is that in Forex there are no pure volumes. Those indicators are based on ticks instead. Volume indicators are widely popular in stock trading, where you can get real volumes from exchanges.
What Technical Indicator to Learn First?
There are plenty of indicators that you can use in trading. New traders often think about which one to choose and learn first. Taking into consideration that the average price is one of the basic concepts of technical indicators, it is recommended to start with the moving average.
This indicator is one of the easiest to understand and apply to your trading strategy. Moreover, it allows you to both follow the current trend and even find entry points. However, MA is great for Forex, while for digital options, it is better to use momentum indicators, which allow you to find entry points at reversals.
How Many Indicators to Apply to the Chart?
This is another important question that many beginner traders often ask. There is a wrong concept of adding a lot of indicators to a single chart to try to predict future price fluctuations or price reversals.
However, in trading, quantity does not necessarily go into quality. If you apply too many indicators to a chart, you risk losing the concept and focus of price, which is the main goal of the whole analysis.
If you apply a single indicator like ATR, for instance, you will not be able to analyze the price properly as you can’t find entry points. Therefore, you need additional tools to build a strategy.
It is impossible to say how many indicators to apply to a chart. It depends on a particular strategy. However, you should always keep in mind that the more tools you add, the less effective your system will be.
Top Forex Indicators for Digital Options
If you are looking for the best technical indicators for digital options, then you are in the right place. Here you can find a list of the top math indicators that will definitely help you in trading:
- BB, or Bollinger Bands. This technical indicator for digital options forms a price dynamic channel, drawing the boundaries of price fluctuations and allowing digital options traders to make better price predictions on both sides. By using this indicator, you can buy Higher or Lower contracts even during a single trend. Moreover, it offers a lot of strategies that you can apply to your trading system;
- Envelope. While Envelopes look similar to BB when it comes to charts, both have different approaches to the calculation of boundaries. Envelopes use fixed percentages, while in BB, the standard deviation is considered. Envelopes allow you to find entry points for digital options trading regardless of the current market situation;
- RSI, or Relative Strength Index. This indicator is one of the best when it comes to price reversal prediction. Moreover, being a momentum indicator, it tells you in advance about future trend changes, which allows you to apply it even to scalping strategies;
- MACD, or Moving Average Convergence Divergence. This technical indicator is among the best for digital options traders. It has high potential as it allows you to find both trading signals and reveal divergencies that may also be useful when you are trading other financial instruments like Forex CFD, stocks, etc.;
Technical Indicators for Digital Options: Tips and Tricks
When you master a particular indicator, there are things that may be useful to you in applying it to your strategies:
- Relying too much on indicators. This is a common mistake for many traders. They add only one indicator and try to squeeze the most out of it. However, in order to create a good strategy, you should take into consideration other factors and search for confluences;
- Learning more about a particular indicator. Many novice traders begin their acquaintance with indicators from the wrong end. They read about the signals that the indicator gives instead of familiarizing themselves with the calculations that lie behind a particular technical analysis tool. This results in mistakes that lead to losses. Before even installing any indicator, you should discover its basics first;
- Using a demo mode. Before using any particular indicator, it would be a great idea to test it on a demo. While everything may look perfect on historical charts, the reality may be the exact opposite of what you have seen on screenshots;
- Most top indicators are not repainting. The best technical indicators for digital options do not change after the candlestick is closed, which makes them very useful. However, you should keep in mind that some technical indicators will repaint and, therefore, may confuse you;
- False signals. While technical indicators may seem reliable, especially when you are using historical data to check them, false signals may appear. You should prepare yourself for them and try to minimize their influence on your trading system by using additional indicators or other technical analysis tools to refine trading signals.
Technical Indicators: Pros and Cons
Technical indicators are not the only way to analyze price fluctuations. You can also use various drawing tools, Japanese candlesticks, and many more. Therefore, to make the right choice on whether to use indicators or not, you should consider both the pros and cons of applying them.
Technical Indicators Advantages
By using technical indicators, you can rely on the following benefits:
- Easy to understand. Technical indicators are very popular for providing traders with clear trading rules. If you buy on the MA crossover signal, for instance, you can see it clearly on the chart;
- It is applicable to a variety of markets. When using technical indicators, you can apply them for Forex, stocks, commodities, metals, and even cryptocurrencies;
- No preparation is required. With indicators, you don’t need to draw anything on the chart. You can apply them and receive signals almost right away. However, you should keep in mind that some strategies may require periodic or other settings adjustments;
- Comprehensive signals. With technical indicators, most signals are very clear and straightforward. For instance, if you use RSI and the line leaves the oversold area, you can expect the price to grow;
- Fast and easy strategy optimization. You can see the history of price fluctuations with any indicator and see how reliable it is.
Technical Indicators Drawbacks
While there are plenty of advantages to using technical indicators, you can also find several disadvantages:
- There are no perfect indicators. Each particular technical indicator has its disadvantages. Therefore, there are no perfect indicators at all. You will have to spend a lot of time before you find something that suits you;
- Redrawing. Not all indicators give you a clear picture of what is going on in the chart at the moment. Some of them may provide you with pure signals that are redrawn later.
Conclusion
Technical indicators are very popular among traders. They offer clear and comprehensive signals that allow you to find entry points. Those indicators are very useful if you know how to apply them.
FAQ

What is a Trading Indicator?
This is a special technical analysis tool that is calculated by a special formula. Technical indicators are illustrative and very comprehensive, which makes them very popular among traders.
Do Technical Indicators Work?
Yes, they do. However, before applying them, you should test a particular tool and adjust the settings according to your strategy.
What Are the Main Types of Technical Indicators?
There are four main types of technical indicators that you can use. Along with trend following and oscillators, traders can also apply volatility and volume indicators.

